Figure 3.

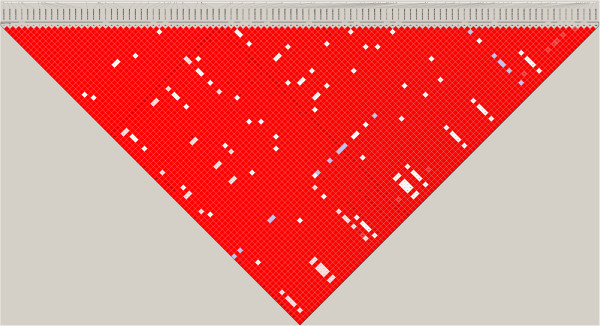
Linkage disequilibrium plot of the pairwise D’ for the identified regions for the length in days of the interval from calving to first insemination (ICF) on BTA13.

Linkage disequilibrium plot of the pairwise D’ for the identified regions for the length in days of the interval from calving to first insemination (ICF) on BTA13.