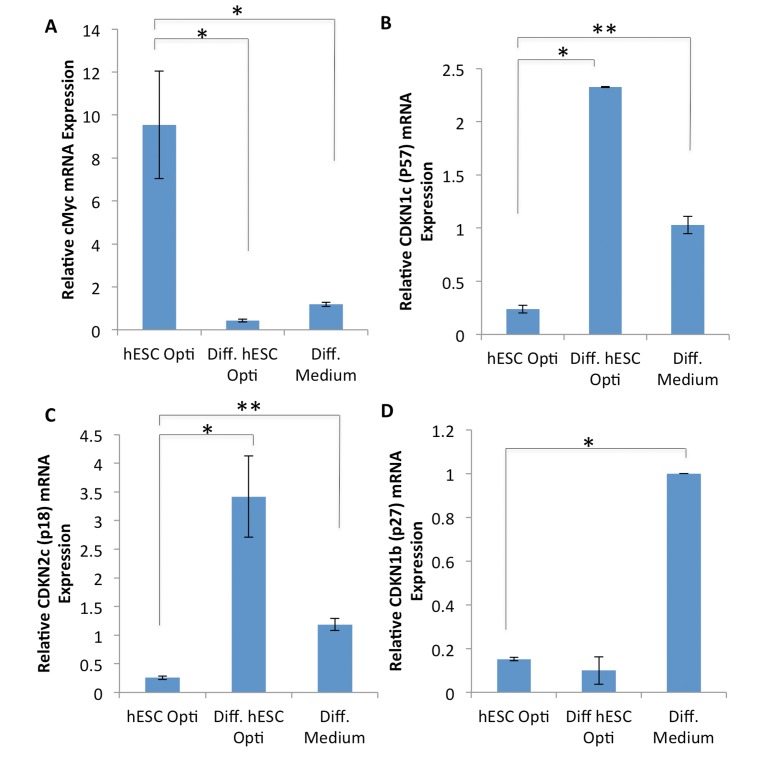
Figure 4. Expression analysis of MAPK regulated genes.
(A-D) Quantification of downstream CDK inhibitor expression genes by qRT-PCR in human myoblasts treated for 72 hours with 50% differentiation medium and 50% of the medium specified, with daily medium changes. The relative expression level was normalized by GAPDH. Significant differences were identified by Student's t tests (*p<0.05 for c-Myc, *p<7×10⁻⁶ and **p<0.005 for p57,*p<0.05 and **p<0.01 for p18, *p<3×10⁻⁶ for p27). Error bars indicate standard error of the mean (n=2-4).

