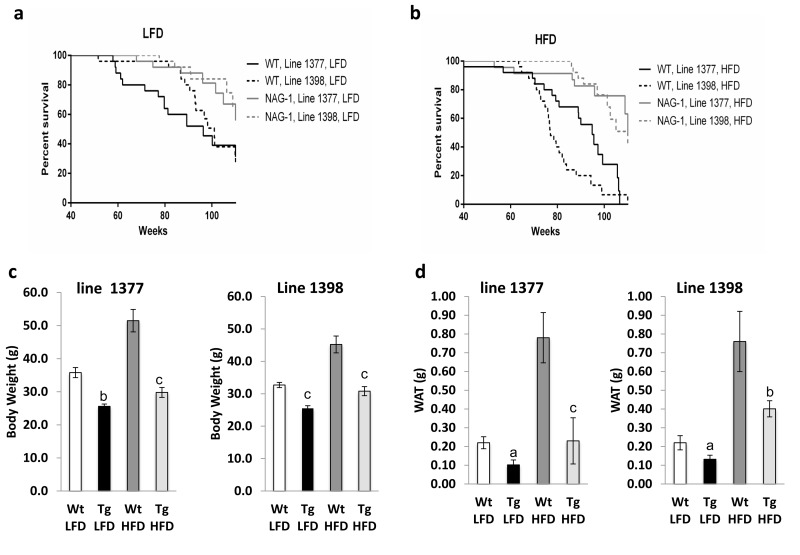
Figure 1. Increased lifespan of female hNAG-1 transgenic mice.
(a-b), Kaplan-Meier survival curves for female Wt and hNAG-1 mice from two transgenic lines, line 1377 and line 1398 (a) LFD (b) HFD. (c), Terminal mean body weights of hNAG-1 and Wt mice at 95±5 wk old in two lines (g). (d), Mean abdominal white adipose tissue (WAT) weights of the mice (g). n=9~18. Data are presented as mean ± SE. a, p<0.05, b, p<0.01 and c, p<0.001 as determined by Student's t-test.

