Figure 5.

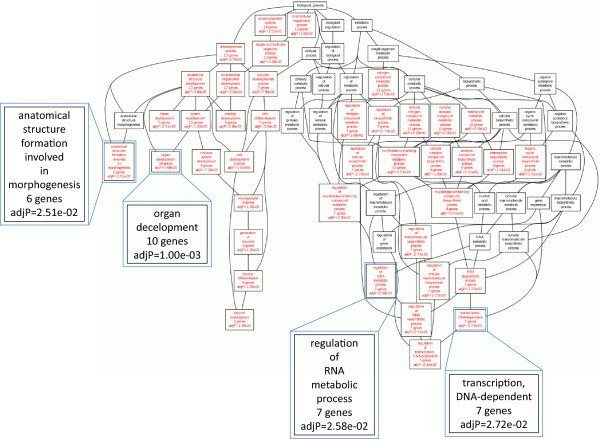
Gene ontology analysis of overlapped genes in up-regulated-miRNA targets set and down-regulated genes set. The enriched terms (statistical significance p <0.01) are shown in red.

Gene ontology analysis of overlapped genes in up-regulated-miRNA targets set and down-regulated genes set. The enriched terms (statistical significance p <0.01) are shown in red.