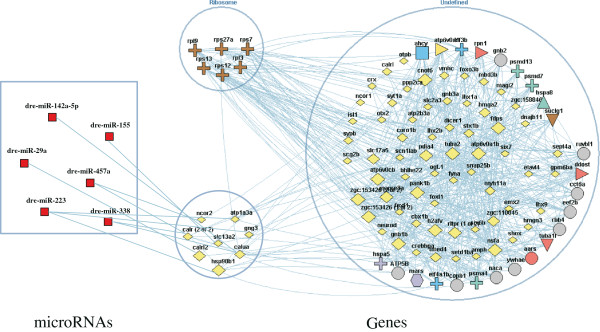
Figure 6.

Network analysis of differential expressed genes and miRNAs. The yellow diamond represents the down-regulated genes (FPKM >1, fold-change >1.3, p-value <0.01), and red square represents the up-regulated miRNAs (fold-change >2.0, p-value <0.05). Other nodes are connected with our query genes by 1-expansion-depth. All the lines represent direct correlation of nodes. The size of nodes represents its connectivity. Bigger the node is, larger its connectivity is. Central nodes (connectivity >30) are atp6v0a1b, pank1b, fdps, h2afv, atp6v0cb, cnot6, nsfa, gnb1b, and zgc:153426.
