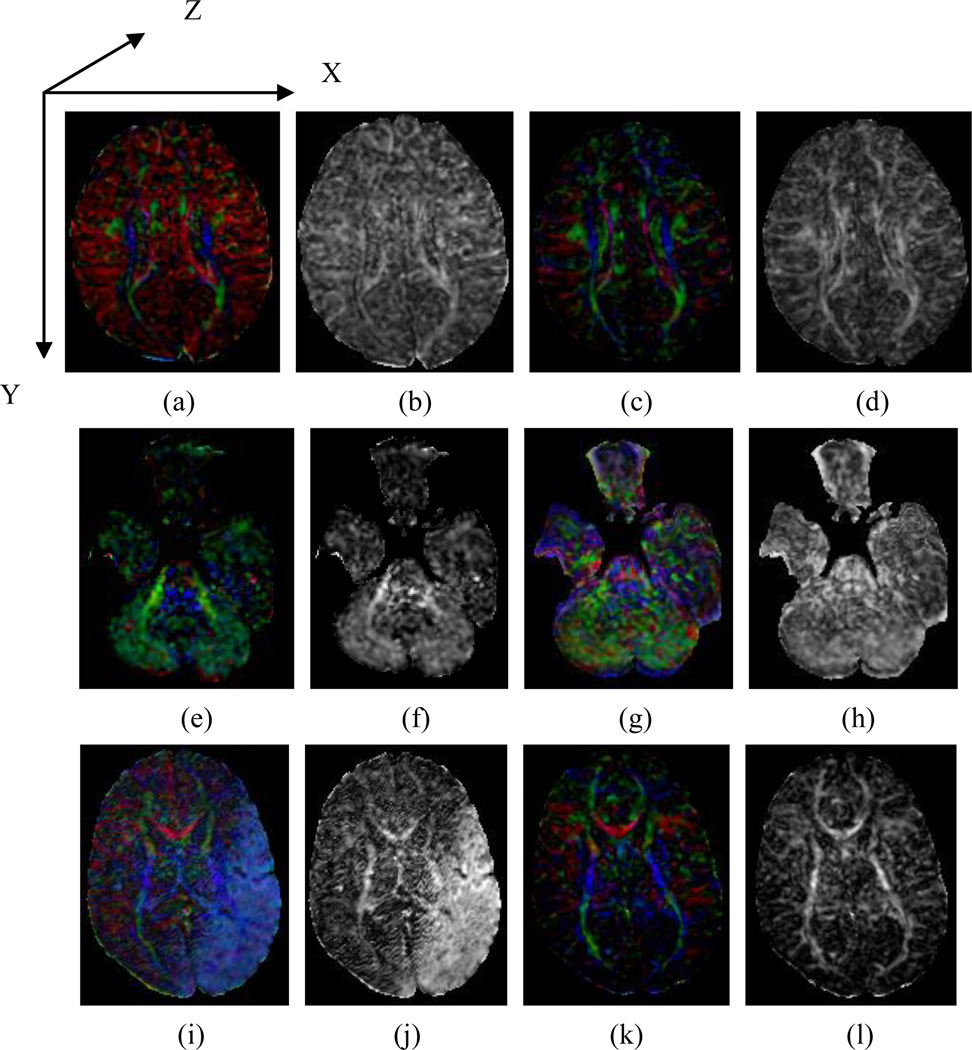
Fig. 1.
A comparison of motion-corrupted and normal DTI data. (a)(e)(i) are color-encoded fractional anisotropy (CFA) images of a typical, motion-corrupted DTI dataset. (b)(f)(j) are the fractional anisotropy (FA) images corresponding to (a)(e)(i), respectively. (c)(g)(k) are the CFA images of a motion-free DTI dataset from the same participant. (d), (h) and (l) are the corresponding FA images corresponding to (c), (g), and (k), respectively. The difference in the CFA images between the motion-corrupted and motion-free DTI data is a color cast, whereas the FA images of motion-corrupted and motion-free diffusion-weighted images can appear similar (Fig. 1b and d). In the figures, we mapped X-component of a direction to red, Y to green and Z to blue.

