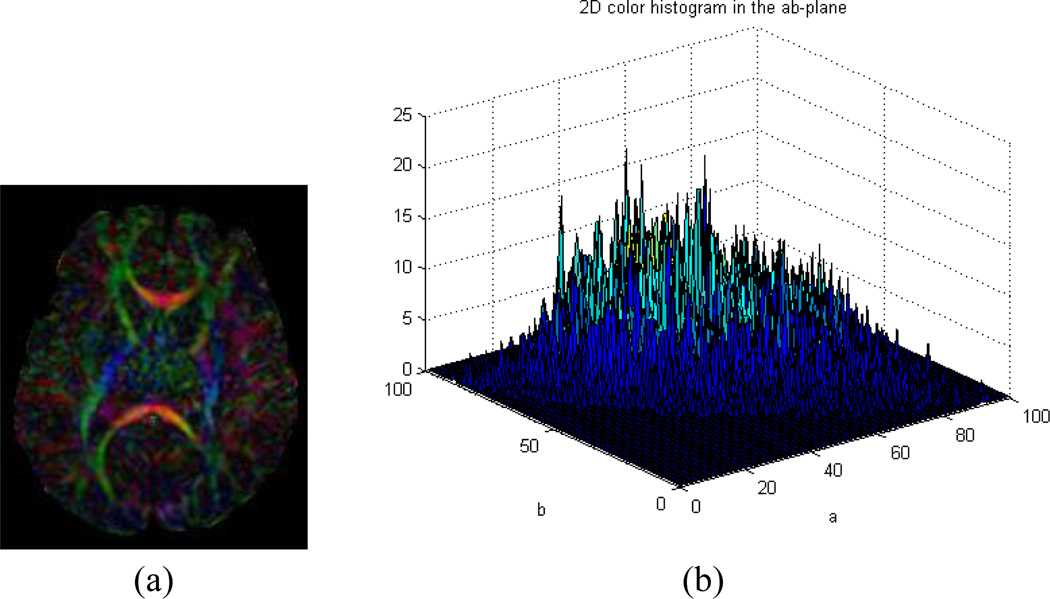
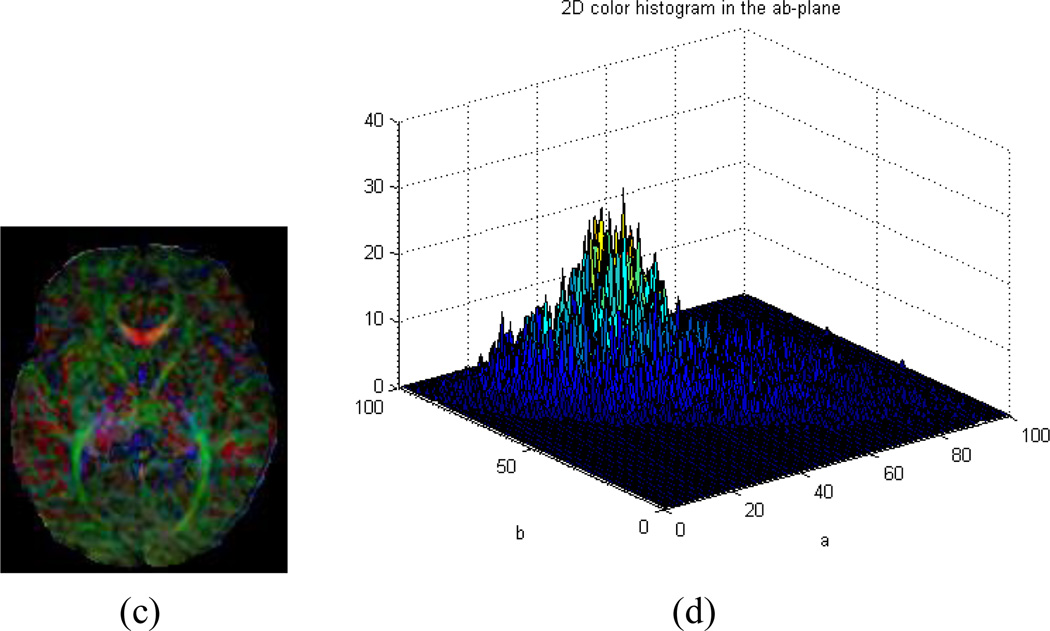
Fig. 2.
(a)~(b) A color-encoded fractional anisotropy (CFA) image containing no color cast contains several peaks distributed throughout the 2D histogram in the ab-plane of CIELAB color space. (a) A motion-free CFA image. (b) 2D histogram of (a) in the ab-plane of CIELAB color space; (c)~(d) A motion-corrupted CFA image with a color cast showing a 2D histogram with a localized peak far from center in the ab-plane. (c) A CFA image with color cast. (d) 2D histogram of (c) in the ab-plane of CIELAB color space.


