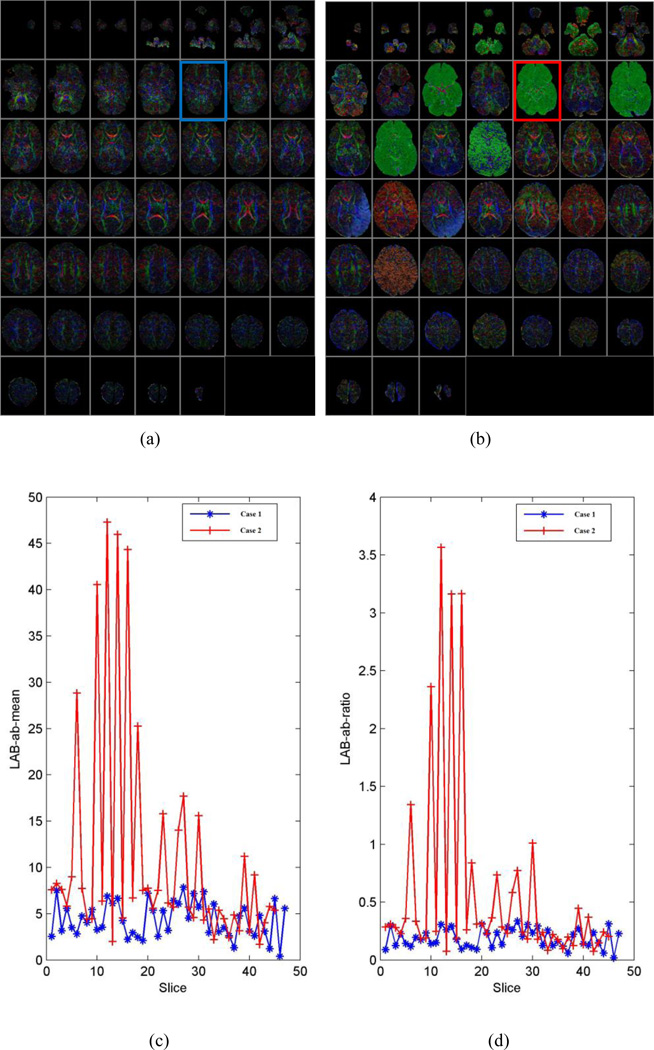
Fig. 3.
Typical DTI datasets used for training and their LAB ab-means and ratios. (a) Color-encoded fractional anisotropy (CFA) image of a motion-free series (case 1). (b) CFA image of a motion-corrupted series (case 2). (c) Distribution of distance from the center of the 2D histogram to the neutral axis (µ) for two DTI series (cases 1 and 2). (d) Distribution of the ratio (ω) of the distance to the standard deviation for the two DTI series. The higher the values of µ and ω, the worse the quality of the corresponding CFA image, such as the image highlighted in blue and red rectangles (i.e., slice#12) in figure (a) and (b).

