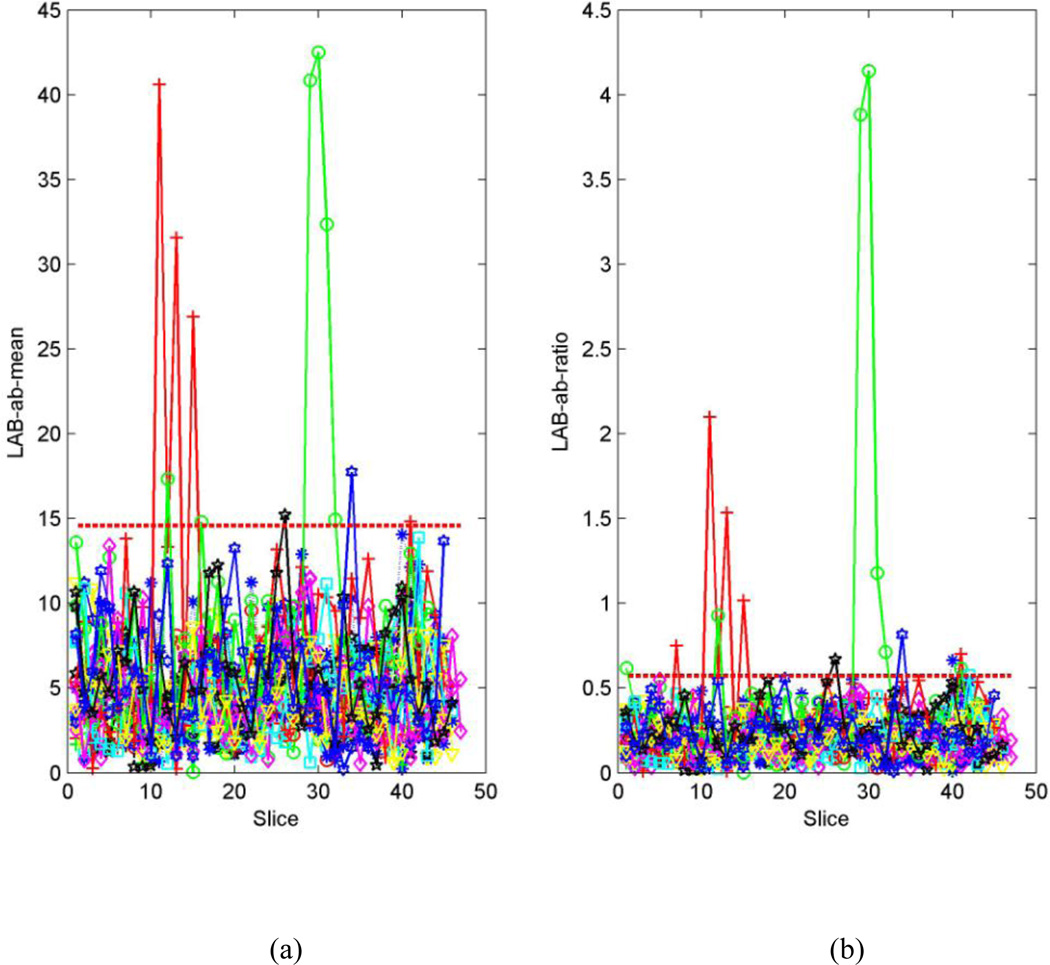
Fig. 5.
Randomly-selected series from the DTI dataset for testing. Each line represents one series. (a). Distribution of distance from center of the 2D histogram to the neutral axis (µ) to the neutral axis for the all series in the testing set. (b). Distribution of ratio (ω) of the distance to the standard deviation for the all series in the testing set. If the µ of the assessed CFA image is greater than Tµ (dashed red line) or if the ratio ω of the assessed CFA image is greater than Tω (dashed red line), then the CFA image is classified as having a color cast.

