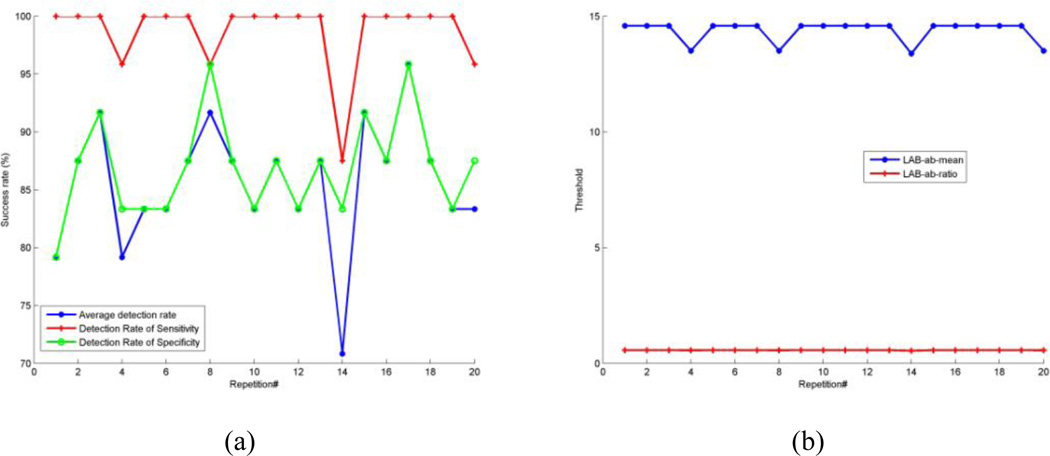
Fig. 6.
Detection result for the testing dataset for all 20 repetitions. (a). Detection result for overall average detection rate, sensitivity rate, and specificity rate, respectively. (b). Threshold of distance from center of the 2D histogram to the neutral axis (µ) and threshold of ratio (ω) of the distance to the standard deviation.

