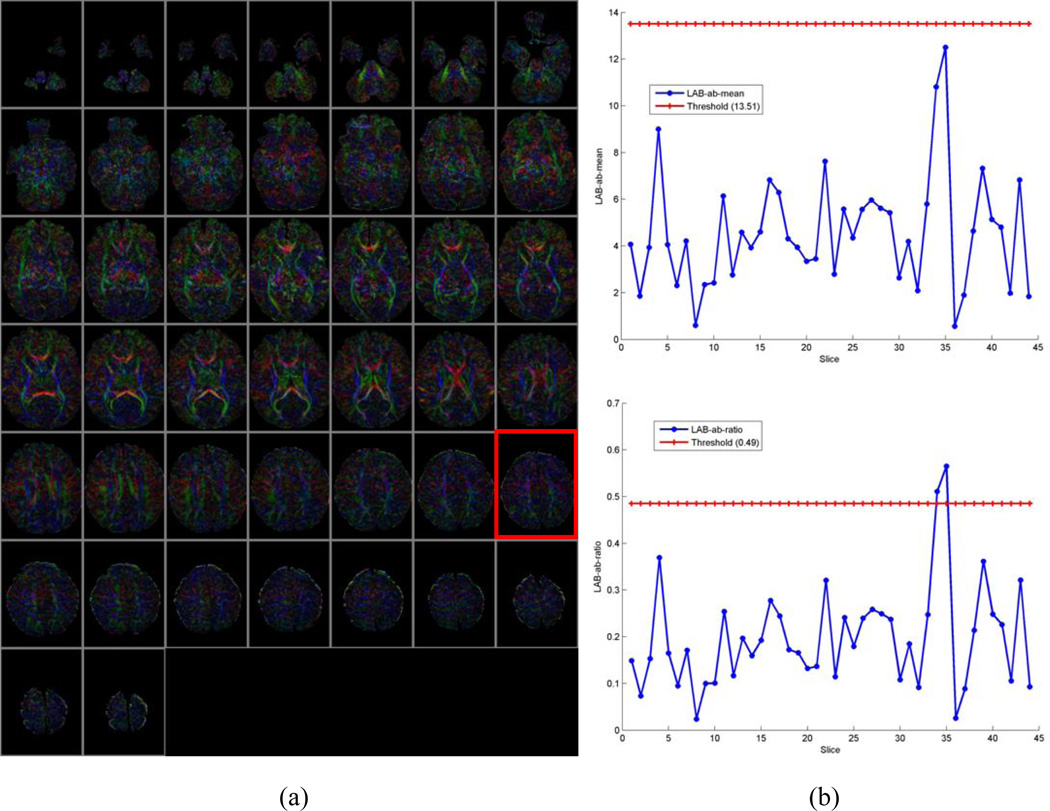
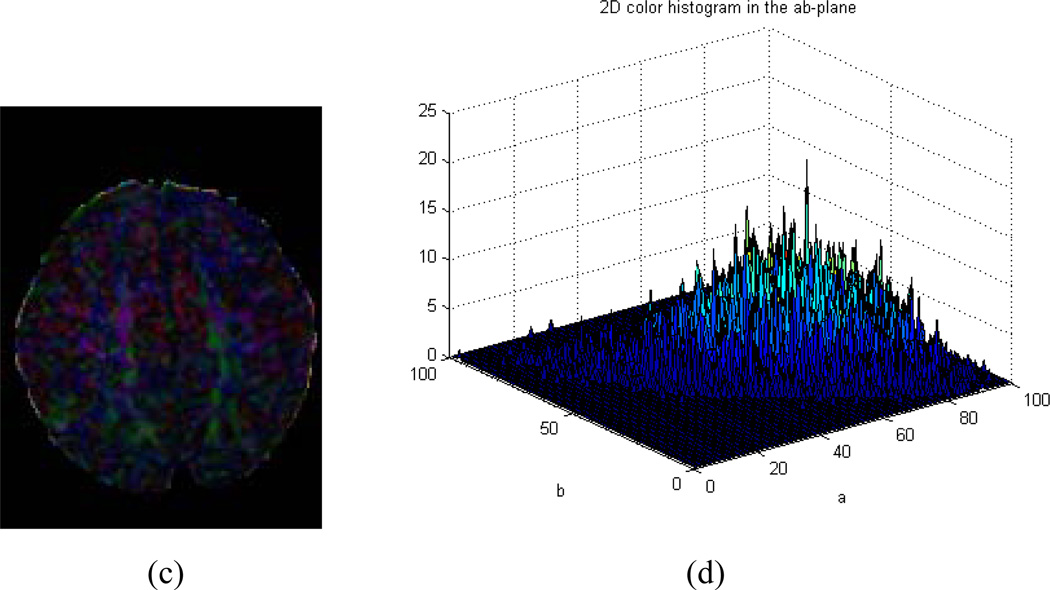
Fig. 8.
Example of false negative. (a) CFA images of all slices. (b). Upper: distribution of distance from the center of the 2D histogram to the neutral axis (µ); Bottom: distribution of the ratio (ω) of the distance to the standard deviation. (c). CFA image of Slice#35 marked with red rectangle in (a). (d). 2D histogram of (c) in the ab-plane of CIELAB color space. This is an example of a CFA image with no color cast but with predominant color closing the cerebral cortex.


