
Figure 15.
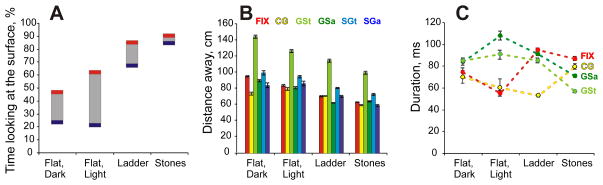
Changes in the gaze behavior with increase in visual complexity of walking environment and demand on visual guidance of stepping. A: The minimal (blue) and maximal (red) time spent looking at the walking surface across all cats. Grey boxes highlight spread between minimal and maximal values. B: Distance in front of the cat where different gaze behaviors began. C: Duration of gaze behaviors during different locomotor tasks. In B, C: mean ± SEM values across all cats are shown for different gaze behaviors. GSa - away gaze shifts (purple), GSt - toward gaze sifts (blue), FIX – gaze fixations (red), CG – constant gaze (yellow), SGa – slow gaze directed away from the cat (green), SGt – slow gaze directed toward the cat (light green). In C, a dotted line of a corresponding color highlights a trend for the parameter.