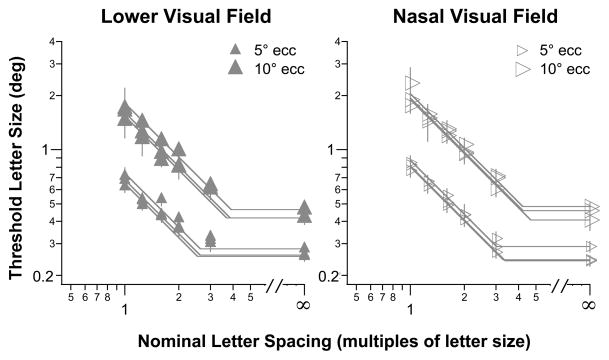
Figure 3.
Threshold letter size (deg) is plotted as a function of nominal letter spacing (multiples of letter size) for the three older adults with normal vision, tested at 5° (smaller symbols) and 10° (larger symbols) in the lower (left panel) and nasal (right panel) visual fields. Both eccentricities in the same visual field are plotted in the same panel, and data from all three observers are plotted (hence, three sets of data for each eccentricity). The straight lines through the data represent the best-fit bilinear function (see text for details) fitted to each set of data (each eccentricity for each observer). The value on the abscissa corresponding to the intersection of the two lines represents the nominal critical spacing. Error bars represent ± 1 SEM of the size-threshold measurement.

