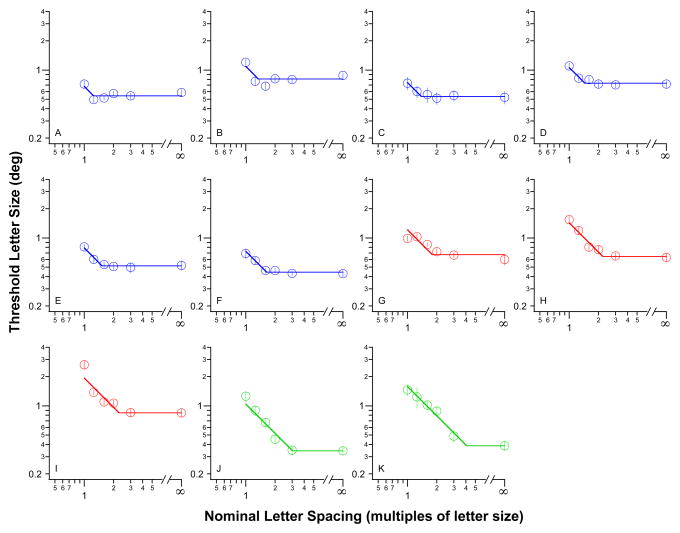
Figure 4.
Threshold letter size (deg) is plotted as a function of nominal letter spacing (multiples of letter size) for the 11 observers with AMD. Each panel shows the data of one observer. The solid lines represent the best-fit bilinear function (see text for details). The value on the abscissa corresponding to the intersection of the two lines represents the nominal critical spacing. Error bars represent ± 1 SEM of the size-threshold measurement.

