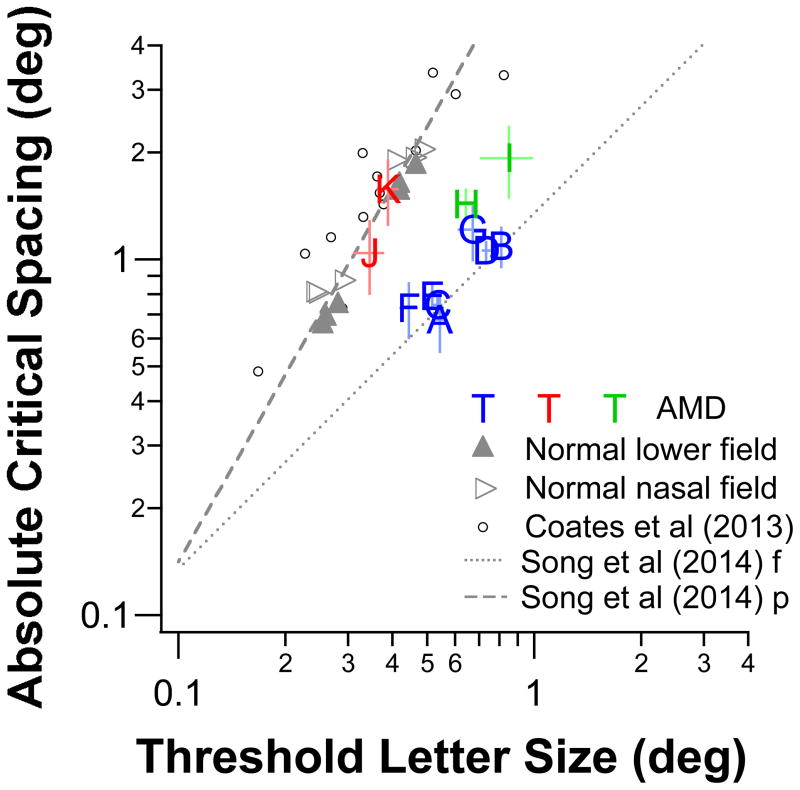
Figure 5.
Absolute critical spacing (deg) is plotted as a function of threshold letter size (deg) for the 11 observers with AMD. Data for observers with AMD are plotted using their observer ID and are color coded according to whether the properties of letter recognition for the observer are consistent with a limitation by size (blue), spacing (red) or both (green). Data obtained from the lower (filled triangles) and nasal (unfilled triangles) visual fields of the three normally sighted observers are also plotted. For comparison, we included the normal peripheral data from Coates et al (2013) obtained from 3 to 10° eccentricity (small unfilled black circles) and the two lines relating the absolute critical spacing with letter size as in Figure 4 in Song et al (2014) (f stands for foveal data and p stands for peripheral data). Despite differences in the experimental paradigm, the three studies (ours, Coates et al’s and Song et al’s) yielded data in the normal periphery that are consistent with one another. Error bars represent ± 1 SEM for both spacing and size estimates.

