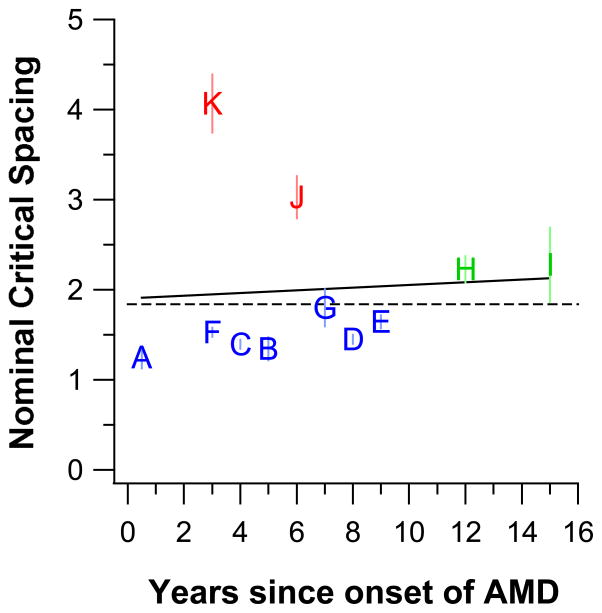
Figure 6.
Nominal critical spacing (multiples of letter size) is plotted as a function of the number of years since the onset of AMD. Each observer is represented using his/her ID and color-coded as in Figure 5. The dashed line represents the criterion value of 1.84 adopted by Song et al (2014) to classify whether an observer’s letter recognition is limited more by size (values < 1.84) or spacing (values > 1.84). The solid black line represents the best-fit regression line to the data, with a slope of 0.015±0.068, which is not different from a slope of zero, implying no relationship between the nominal critical spacing and the duration since onset of the disorder. Error bars represent ± 1 SEM.

