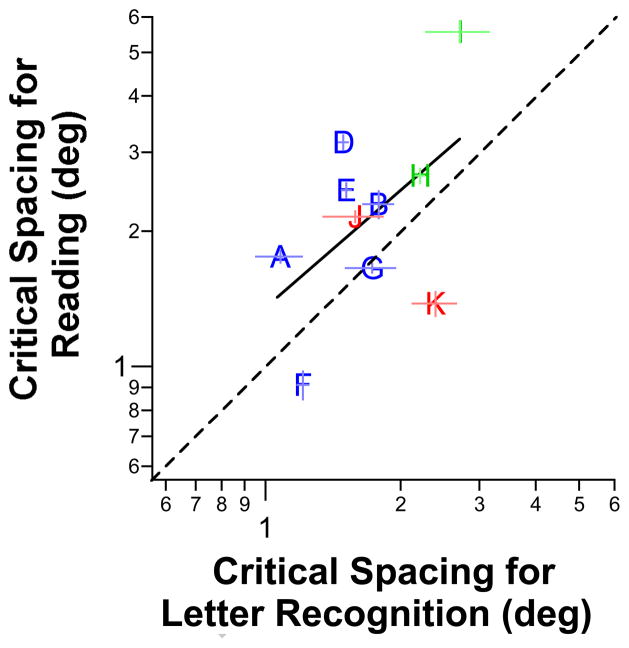
Figure 7.
Absolute critical spacing for reading (deg) is plotted as a function of the absolute critical spacing for letter recognition (deg). Critical spacings for reading were obtained from Chung (2012) while critical spacings for letter recognition were based on an accuracy criterion of 80% and thus are different from the values plotted in Figure 5. Observer C is not included because she did not participate in the study of Chung (2012). The dashed line represents the unity line — the critical spacing for reading is identical to that for letter recognition. Although the black regression line (fitted to log-log data) shows a reasonable trend between the critical spacing for reading and letter recognition, the correlation was not significant (see text for details). Error bars represent ± 1 SEM.

