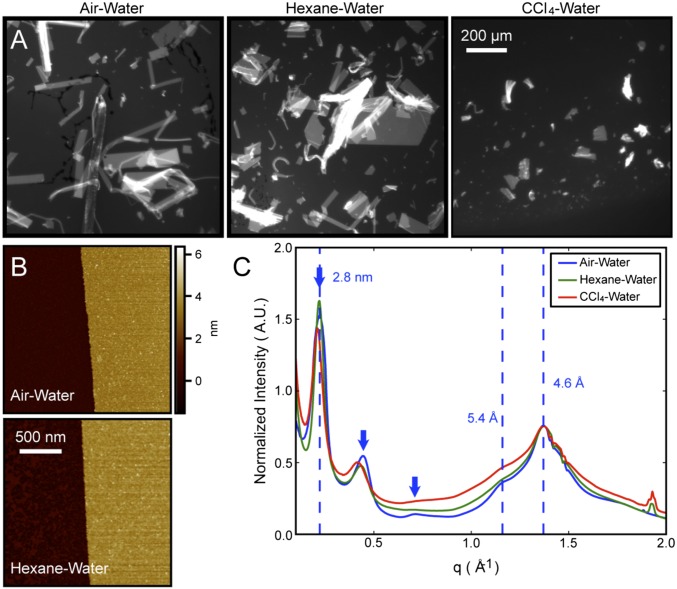
Fig. 3.
Characterization of 1 nanosheets formed from air–H2O and oil–water interfaces. (A) Fluorescence microscopy images of Nile-red-stained nanosheets deposited on agarose gel. (B) AFM image of the edge of an individual peptoid nanosheet, deposited on a mica substrate and imaged in ambient air. (C) Powder XRD spectra of a dry, pelleted stack of nanosheets formed from the air–H2O, hexane–H2O, and CCl4–H2O interfaces. Spectra are normalized by the intensity of the 4.6-Å peak. The three equally spaced peaks (denoted by blue arrow) arise from the 2.8-nm thickness of the 1 nanosheet.

