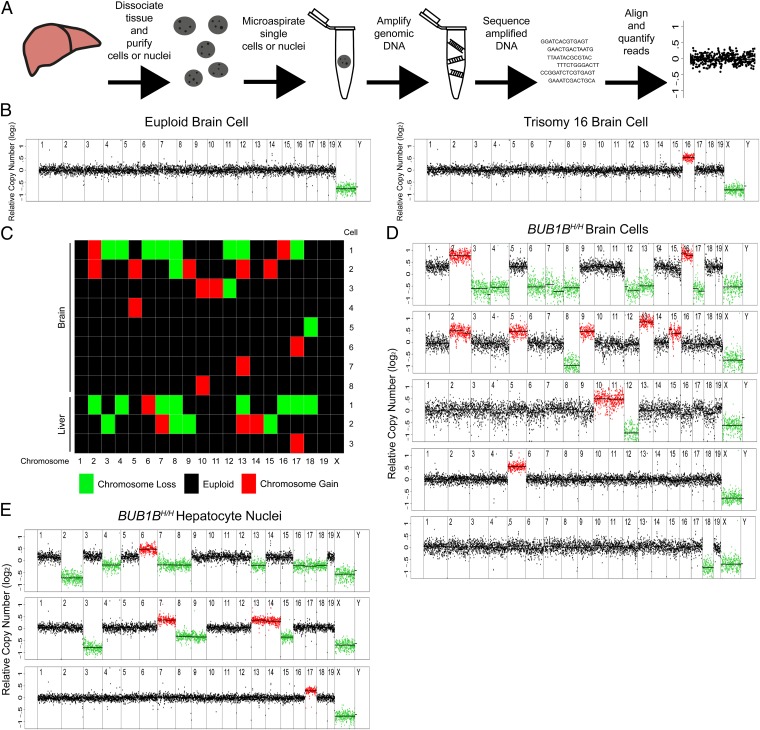
Fig. 1.
Validating detection of aneuploidy by single cell sequencing. (A) Overview of the method used to detect copy number alterations in single cells by whole-genome sequencing. (B) Segmentation plots of a euploid brain cell (Left) and a trisomy 16 brain cell (Right), isolated from male mouse embryos euploid and trisomic for chromosome 16, respectively. Segmentation plots show copy number of single cells relative to a euploid reference on a log2 scale. Segments above threshold for gain are colored in red, segments below threshold for loss are colored in green. (C) Heat map of chromosome losses and gains in aneuploid brain cells and liver nuclei from BUB1BH/H mice. (D) Segmentation plots of five aneuploid cells from a BUB1BH/H mouse brain. (E) Segmentation plots of three aneuploid nuclei from a BUB1BH/H mouse liver.

