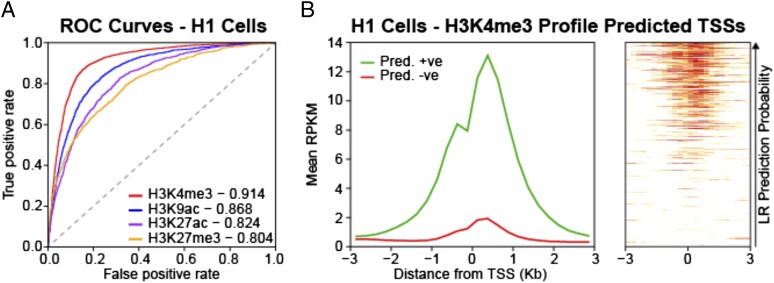
Fig. 1.
Histone modifications can be predicted from DNA sequence. (A) Representative ROC curves of the performance of k-mer LR-based classifiers for histone modifications at gene promoters in H1 cells. The AUC for each task is indicated in the legend. The ROC curves shown are for a single iteration of a 70–30 split of the data. (B) H3K4me3 profile at test set promoters in H1 cells. Shown on the Left is the mean H3K4me3 profile at promoters predicted to be positive (green) and negative (red) for H3K4me3 in a single iteration of the analysis. The cutoff used was P = 0.5. The panel on the Right shows the profile at all of the promoters in the test set ordered by their predicted probability of being marked by H3K4me3 (white, low; red, high).

