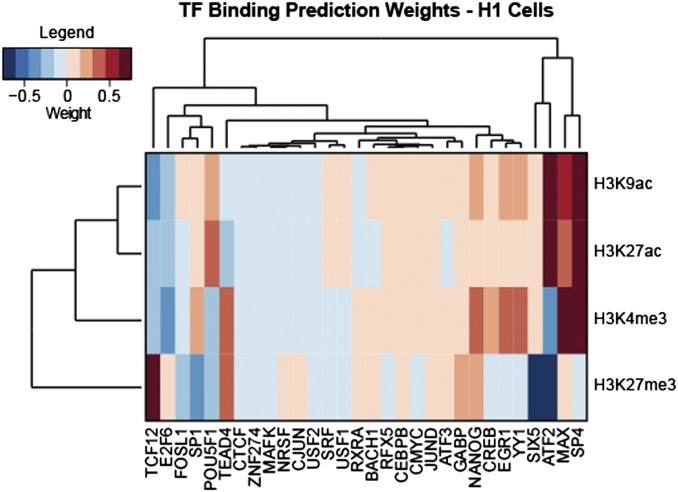
Fig. 4.
TF weights uncover histone modifier–TF interactions. Heat map of LR weights from the prediction of histone modifications from TF-binding data in H1 cells. Each cell represents the weight assigned to a particular TF in predicting the occurrence of a particular histone mark. Both the rows and columns were subject to hierarchical clustering.

