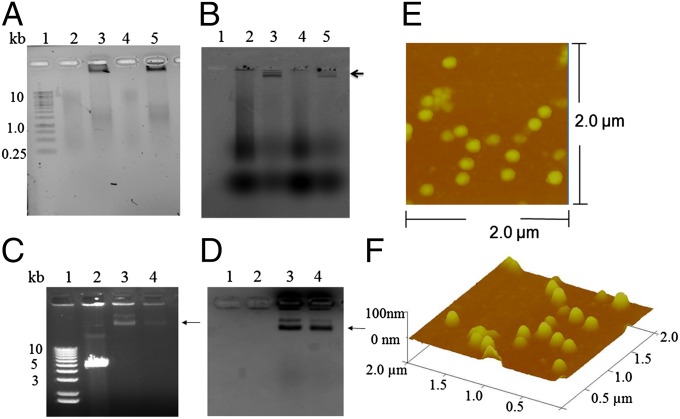
Fig. 2.
Packaging of fluorescent dsDNAs into T4 procapsids and assessment of the integrity of T4 NPs. (A) Ethidium bromide staining viewed on a biospectrum imaging system (UVP). The gel was run for only a short time and adjusted to a bright background with less contrast to visualize the low molecular weight smear DNA. (B) The unstained gel viewed on a Typhoon imager using an Alexa 488 dye filter. The L-segment (3,320 bp) of ф6 dsRNA was reverse transcribed using aha-dCTP followed by conjugation with Alexa 488 NHS ester (Amersham), as shown in lane 2, and the dye-labeled L-segment dsDNA was packaged into control T4 procapsids lacking the Cre enzyme, as shown in lane 3 (arrow near the loading well). The S-segment (1,520 bp) of ф6 dsRNA (lane 4) was reverse transcribed by the same procedure. The dye-labeled S-segment dsDNA is shown in lane 5. Lane 1 shows the 1-kb DNA size marker (Thermo Scientific). The arrow indicates the position of packaged DNA retained by procapsids near the top of the agarose gel. (C and D) Images of the same agarose gel viewed on a Gel Doc EZ imaging system (Bio-Rad). (C) Ethidium bromide staining image with more contrast (dark background). The agarose gel was run for a longer time to allow the packaged DNA to migrate further for visualizing the packaged DNA on the top (indicated by the arrow) due to slow migration of the large procapsids. The doublet bands possibly result from two different charges of the procapsids. The unpackaged linear EGFP DNA with a size of ∼5.5 kb is shown in lane 2, and packaged EGFP DNA with a size >10 kb is shown in lane 3. Packaged Alexa 480-labeled L-segment dsDNA with a size >10 kb is shown in lane 4. (D) Coomassie blue staining image of C. T4 capsids in lanes 3 and 4 were stained with Coomassie blue as indicated by the arrow. (E and F) Purified T4 proheads for DNA packaging were visualized by AFM with a scanning area of 2.0 × 2.0 µm. A 3D view is shown in F.

