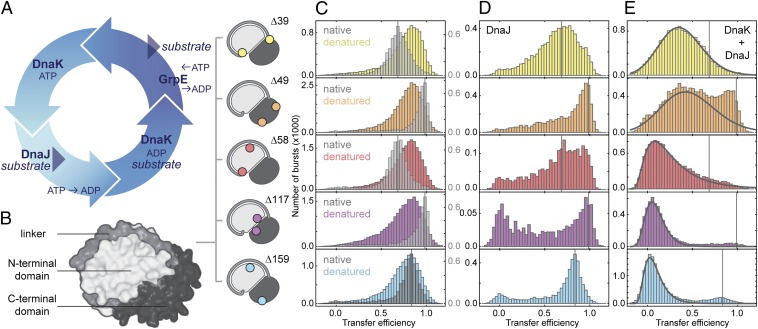
Fig. 1.
DnaK expands the denatured substrate protein. (A) Illustration of the DnaK–ATPase cycle. (B) Surface representation of rhodanese (PDB ID code 1RHS) with the subdomains indicated in different gray levels and the label positions of fluorescent dyes for single-molecule FRET measurements shown schematically. (C) FRET efficiency histograms of native rhodanese (gray) and denatured rhodanese under native conditions transiently populated in the microfluidic mixer (colored, measured 125 ms after dilution of rhodanese into native conditions). (D) FRET efficiency histograms of DnaJ–rhodanese complexes (0.5 µM DnaJ). (E) FRET efficiency histograms of DnaK–rhodanese complexes (0.5 µM DnaJ, 10 µM DnaK, and 1 mM ATP; DnaK and DnaJ were added simultaneously to rhodanese). Black lines indicate the DnaK–rhodanese complex population resulting from a fit that takes into account the residual population of refolded and DnaJ-bound rhodanese. The vertical lines in C–E indicate the positions of the FRET efficiency peaks of the native population of the respective rhodanese variants. The small populations at zero transfer efficiency in D (note the axis scaling and the small amplitudes of this population compared with E) originate from incomplete elimination of molecules with inactive acceptor fluorophores by pulsed interleaved excitation.

