Fig. 2.
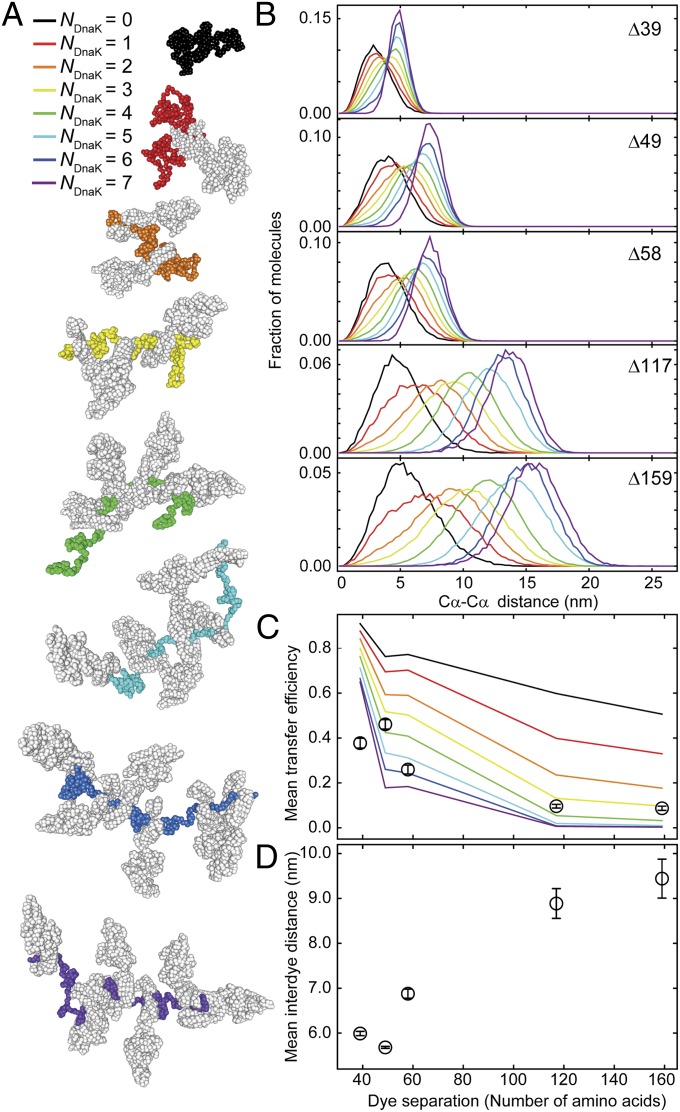
Substrate expansion can be explained by excluded volume effects from binding of several DnaK molecules per substrate molecule. (A) Representative structures from molecular dynamics (MD) simulations of rhodanese bound by a varying number of DnaK molecules (NDnaK) to all combinations of possible DnaK binding sites in the rhodanese sequence predicted by LIMBO (44). The color code from black to purple indicates the number of DnaK molecules (depicted in gray) bound per rhodanese (color code as indicated). (B) Interdye distance distributions from MD simulations for the dye positions of the different rhodanese variants used in the smFRET experiments (Fig. 1) for different NDnaK bound (colors as in A). (C) Comparison of the mean transfer efficiencies calculated from the distance distributions in the MD simulations in B as a function of NDnaK (colored lines) and mean transfer efficiencies from single-molecule data (Fig. 1E, black circles). Error bars indicate the uncertainty due to variability in instrument calibration. (D) Mean interdye distances from the FRET efficiency histograms (Fig. 1E) as a function of the sequence separation of the labeling positions. Mean transfer efficiencies from experimental data were converted to mean interdye distances assuming Gaussian distributions with the shapes of the simulated distributions for NDnaK = 6 and adjustable mean. Error bars indicate the variation of the average interdye distance upon variation of the width of the Gaussian distribution for different NDnaK.

