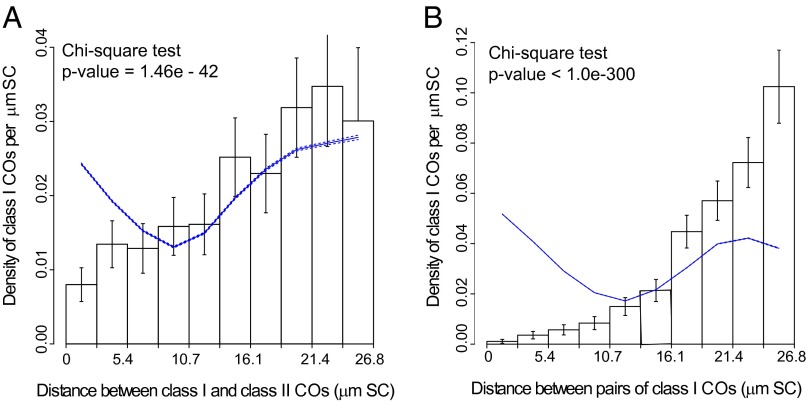
Fig. 3.
Distribution of distances (in µm SC) between different types of RNs, pooled over all chromosomes. (A) Distribution of distances between MLH1-positive RNs (class I COs) and MLH1-negative RNs (class II COs). (B) Distribution of distances (in µm SC) between pairs of MLH1-positive RNs (class I COs). Histograms represent the experimental data. Vertical bars represent 95% confidence intervals for each bin of the histogram. The expected distribution in the absence of any interaction between class I and class II COs is plotted as a solid line with the associated 95% confidence intervals (dashed lines along the solid line). Interference between class I and class II COs (A) and between class I COs (B) is indicated by the lower than expected frequency of events at short distances. Similar figures for individual chromosomes are shown in SI Appendix, Figs. S10 and S12.

