Fig. 1.

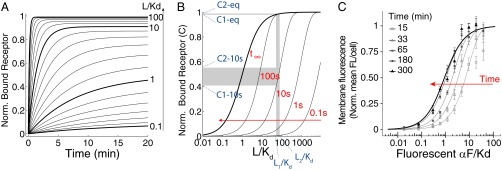
Time-dependent shift of the binding dose–response curve. (A) Time course of receptor/ligand complex formation for different ligand concentrations (relative to the affinity dissociation constant, Kd), in the range 0.1–100 Kd. We computed values for the case of one-step binding using the reaction , with the following αF binding reaction rates: k+ = 1.9 105 M−1⋅s−1 and k− = 0.001 s−1 (15, 16). We assumed that the concentration of free L over time is constant. Norm., normalized. (B) Dose–response curves for the receptor/ligand reaction computed at different times, as indicated over the curves (and with a red arrow). Two concentrations, L1 and L2, result in well-separated levels of occupied receptor C1 and C2 at 10 s (0.4211 and 0.5483, respectively), but not at the equilibrium values C1-eq and C2-eq (0.9821 and 0.9877, respectively). (C) Yeast cells of strain YAB3725 [∆bar1, PSTE2 STE2(T305)-CFP] were grown and stimulated with the indicated amounts of a fluorescent αF derivative (37), and the binding was determined by fluorescence microscopy as explained in Materials and Methods. The mean and 95% confidence interval for the mean are shown for each concentration and time. A simple binding model was globally fitted to the data, resulting in Kd = 23 ± 3 nM and k− = 1.0 ± 0.2 10−4⋅s−1 (solid lines).
