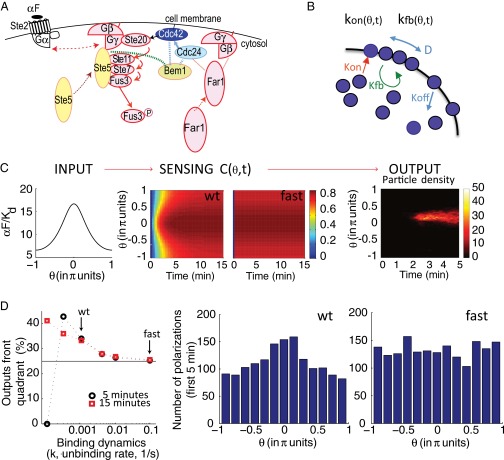
Fig. 4.
Slow binding receptors efficiently convey gradient information to a cell polarization model. (A) Schema of the early events in the PRS (αF) related to gradient detection. αF stimulates recruitment and activation of Cdc42 to sites of receptor activation. αF binds to the receptor (Ste2), causing dissociation of the G protein into Gα (Gpa1) and Gβγ (Ste4–Ste18) heterodimers. Gβγ recruits the MAPK scaffold (Ste5) to the membrane, leading to the activation of the MAPK Fus3. Gβγ also recruits Far1. Far1 recruits Cdc24, the activator of the small G protein Cdc42 (55, 56, 83). Cdc42 stimulates its own activation by binding to Bem1. Bem1 binds Cdc24, which further activates Cdc42 (7, 49). αF stimulates this positive feedback loop further via recruited Ste5, which also binds Bem1 (green dotted line) (84). Active Cdc42 directs the assembly of actin filaments in a later phase of the gradient sensing process. Solid arrows correspond to activation, dotted arrows correspond to molecule movement (e.g., membrane recruitment), dotted lines correspond to protein–protein interactions, and the double arrow indicates dissociation. (B) Schema of the Altschuler model for spontaneous emergence of cell polarity (54). It has four reactions: binding/unbinding of Cdc42 to/from the plasma membrane, recruitment of cytoplasmic Cdc42 to sites where Cdc42 has already been recruited (positive feedback), and lateral diffusion of Cdc42 through the membrane. The associated parameters spontaneous association rate (kon), random dissociation rate (koff), recruitment rate (kfb), lateral diffusion (D), and the total number of signaling molecules (N) were estimated by Altschuler et al. (54) from experimental data. (C, Left) Input to the gradient sensing model: Steady-state αF spatial profile, as in Fig. 3A, corresponds to a cell located at a point in a gradient with an average αF concentration of 10 Kd. (C, Center) Sensing [C(θ,t)], representing normalized bound receptor. Plots correspond using a color scale on the right, at different angles θ (as in Fig. 3A) vs. time, for slow [WT (wt), Left] or fast binding (fast, Right) receptors. For slow dynamics, we used published binding rates of αF to Ste2, k+ = 1.9 × 10⁵ M−1⋅s−1 and k− = 0.001 s−1 (15). For fast dynamics, we used k+ and k− that are 100-fold greater, maintaining the same Kd. Thus, the parameters are = 10, a/d = 0.3, and k− = 0.001 (slow) or 0.1 (fast) (SI Appendix, section 5.1). (C, Right) Example of simulation output: Plot corresponds to particle density at the membrane using a color scale, indicated by a bar on the right, at different angles θ (as in Fig. 3A) vs. time. (D, Left) Percentage of polarizations in the front quadrant as a function of binding dynamics (rate k− at constant Kd) for a cell located as in C after 5 min (black ●) or 15 min (red ■) of simulation. Of the tested k− rates, only those rates lower than or equal to 0.001 1/s resulted in polarizations in the front quadrant that were significantly different from random (25%, black line), P < 0.05. Arrows indicate the results shown in the histograms. At the slowest rate tested, there were no polarizations in the first 5 min. (D, Right) Histograms showing the number of stochastic simulations with polarization at the indicated angles , using slow (Left) or fast (Right) ligand-receptor binding dynamics (2,000 simulation runs each). The size of the bins is π/6.5. The polarization state was measured at t = 5 min. Coupling between occupied receptor and this model was done through parameters kon and kfb as follows: and where Aon and Afb are the coupling parameters. Aon = 0.0012, Afb = 23, koff = 9 min−1, D = 1.2 μm2, and N = 103 (SI Appendix, Fig. S6).

