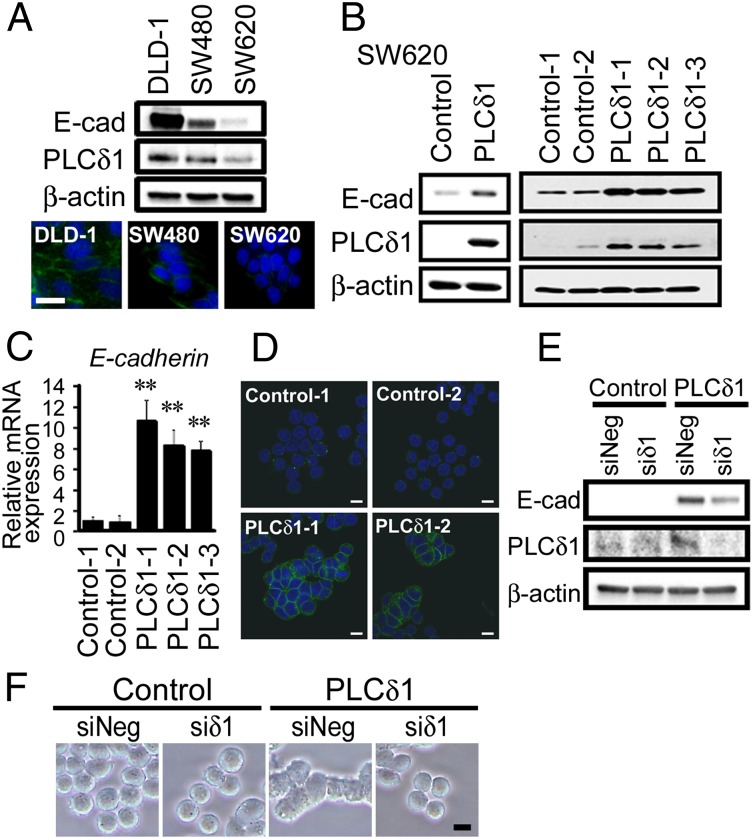
Fig. 2.
PLCδ1 induced the expression of E-cadherin. (A, Upper) The expressions of E-cadherin, PLCδ1, and β-actin (as a loading control) in DLD-1, SW480, and SW620 cells were determined by Western blotting. (A, Lower) E-cadherin and nuclei were stained with anti–E-cadherin antibody and hoechst33342, respectively (blue, nuclei; green, E-cadherin). E-cad, E-cadherin. (Scale bar: 20 µm.) (B) SW620 cells were transfected with either PLCδ1-expression vector or the relevant empty vector and then selected with G418 treatment for 8 d. The expressions of E-cadherin, PLCδ1, and β-actin (as loading control) in (Left) bulk or (Right) stable clone cells were determined by Western blotting. (C) PLCδ1-overexpressing stable clones (PLCδ1-1, -2, and -3) and the relevant control clones (Control-1 and -2) were assessed for E-cadherin mRNA expression by qRT-PCR analysis. The relative expression levels of E-cadherin, normalized to β-actin (as an internal control), are shown (n = 3), with the value of Control-1 set as one. Statistical analysis was performed using the Tukey multiple comparison of means test. **P < 0.005. (D) E-cadherin (green) and nuclei (blue) were observed by confocal microscopy. (Scale bar: 10 µm.) (E) The PLCδ1-overexpressing stable clone (PLCδ1-1) and the relevant control clone (Control-1) were transfected with siRNA against PLCδ1 (siδ1) or nontarget siRNA (siNeg) and assessed by Western blots for the indicated proteins. (F) The morphology of the cells in E is shown. (Scale bar: 10 µm.)

