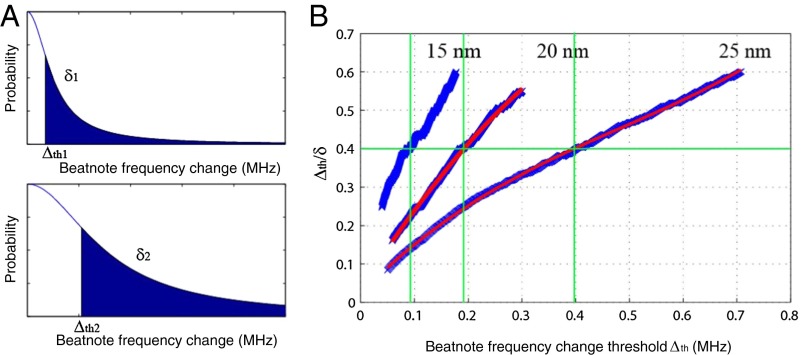
Fig. 8.
Measurement of an ensemble of nanoparticles using scatterer-induced beatnote frequency changes of a WGM Raman microlaser. (A) The distribution of the discrete changes in Raman laser beatnote frequency. Larger particles induce larger changes with wider distribution. However, the shapes of beatnote frequency-change distributions are the same. (B) The relations between Δth/δ and Δth for detected NaCl particles of radii 15, 20, and 25 nm (from left to right). At the same Δth/δ ratio, the corresponding Δth value gives the estimated width of the distribution of beatnote frequency changes.

