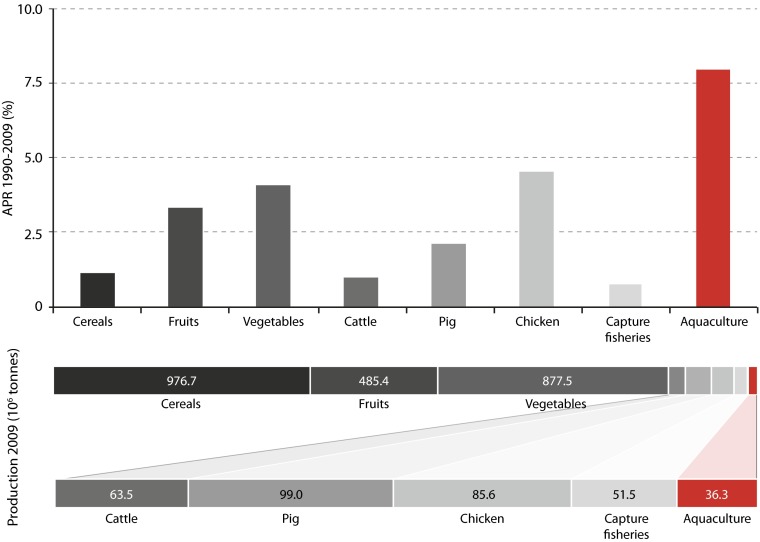
Fig. 1.
Comparison of growth of aquaculture and main food commodities/groups (based on refs. 1 and 2): Growth expressed as annual percentage for the period 1990–2009 and production for 2009. Data on meat from animals obtained from Tacon and Metian (3) and FAO/FAOSTAT (2). Similar sources (1, 2) for data on production of cereals, fruits, and vegetables.

