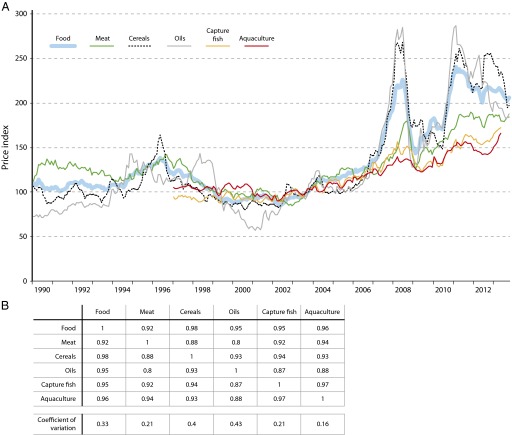
Fig. 2.
(A) Trends in food prices by sector from 1990 to 2013. The y axis is a normalized average (typically, a weighted average) of price relativity for a given class of goods or services in a given region over time (19). (B) Matrix showing the correlations between the sectors and the coefficients of variation. The data are based on global volumes.

