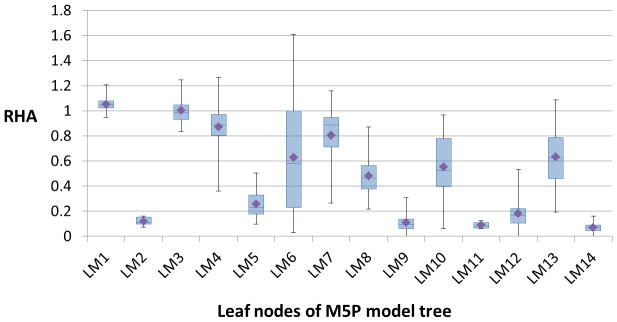
Figure 3.

Box-plots summarizing the distribution of experimental RHA values of samples at each leaf node of the M5P model tree. The diamond symbol in each box-plot corresponds to the average RHA value calculated based on the RHA values of all samples in the respective leaf node.
