
Figure 3. Microglia are adjacent to all RGC compartments in D2 mice.
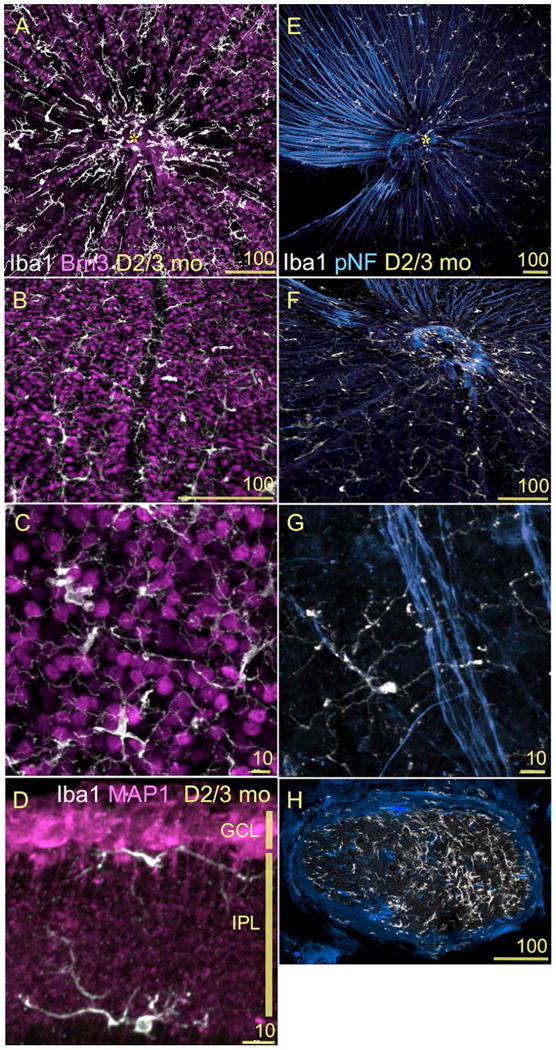
(A-H) Confocal images showing the spatial relationship between RGCs and microglia in 3mo D2 retinas. Scale bars indicated in each image. A-C) Double immunostaining for Iba1 (white) and Brn3b (magenta) of retinal whole mounts. A) This view of the entire central retina, at the levels of the NFL and GCL, reveals both the geometry of the microglial mosaic and their distribution in relation to RGC nuclei. B) A higher magnification view of the GCL shows the localization of perivascular microglia (vertically across the center of the field), and of the parenchymal microglia intersperse between RGCs. C) A close up of RGC nuclei and microglia with diverse shape and complexity. Between 1 and 3 mo of age, we detect an approximate ratio of 1:18 microglia to RGCs along different GCL eccentricities. D) Double immunostaining for Iba1 (white) and MAP1 (magenta) of retinal sections spanning the GCL and IPL, shows the finest branches of microglial processes in direct apposition to RGC dendrites. E-G) Double immunostaining for Iba1 (white) and pNF (blue) of retinal whole mounts imaged at the NFL level. RGC axon bundles extend across the retina towards the optic disc (asterisk). Microglia intercalate with these bundles. F) A close up view of the optic disc region shows the dense coverage of microglia processes branching along the NFL, as well as the clustering of microglia at the optic disc. G) An individual microglial cell is shown with its soma and a thicker primary process stretching along a single RGC axon, while other very ramified processes from this cell reach across an axon bundle. The distance between microglial somata positioned along an axon bundle varies between 100 and 500 μm. H) A cross-section of the myelinated optic nerve shows the local population of microglial cells. The density of microglial cells is lower in the left region of the nerve where axonal pNF expression is normal. In comparison, the right half of the nerve shows abnormally reduced pNF expression and a higher density of microglia.