
Figure 5. Iba1 reliably labels the entire mosaic of microglia resident in the retina.
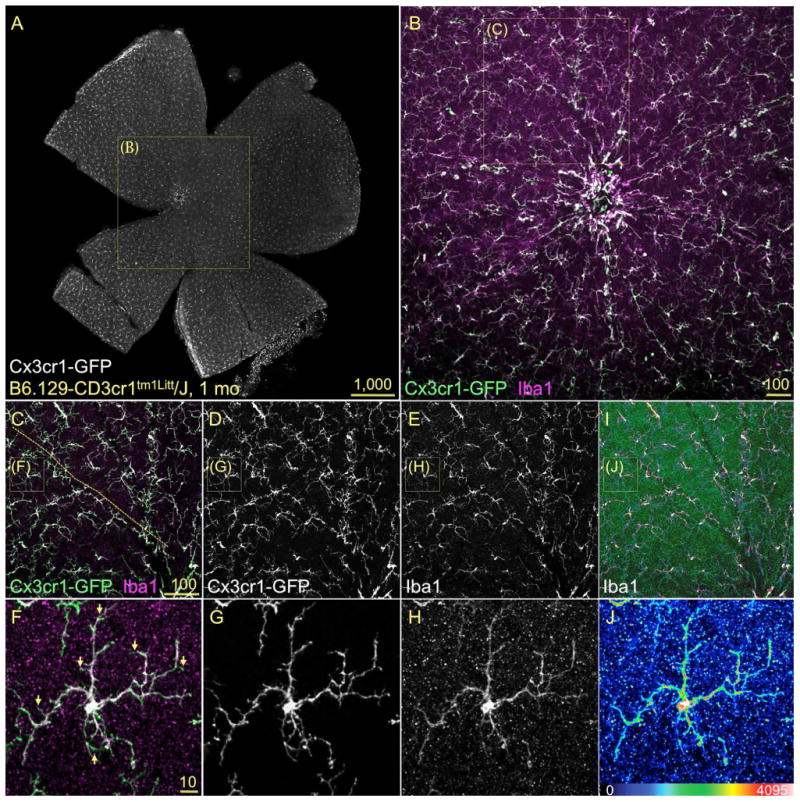
Confocal images of flat mounted retinas immunostained for Iba1 in 1mo GFP-Cx3cr1 mice, showed as maximum projection of innermost 25 μm. A) A view of the entire inner retina showing GFP+ microglia localized to the NFL and GCL. B) The retinal central field (box in A) displays the microglia co-expressing GFP (green) and Iba1 (magenta) with high localization (white areas), both around the optic disc and all towards the peripheral regions. C-E) The observation of the overlay and single channels at higher magnification (box in B) reveals that the overlap of Iba1 and GFP extend throughout the mosaic, both in parenchymal and perivascular microglia (vessel location indicated with dashed line in C). F-H) At the cell level (box in C-E), the overlay of GFP and Iba1 signals shows almost complete colocalization (F, white), spanning the cell soma and the complex ramifications, except for the finest processes (F, arrows). I-J) The color-coding of Iba1 expression intensity denotes variable expression levels within the mosaic and between different cell compartments. Maximal Iba1 expression intensity localizes to soma and branching points, with lowest levels extending the length of the cell processes.