
Figure 8. Microgliosis coincides with microglia activation in D2 retina and ONH.
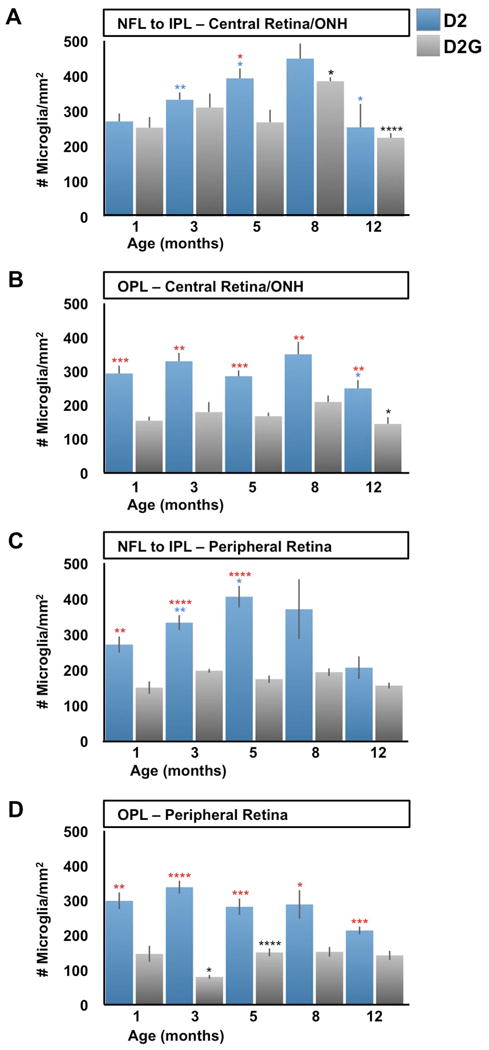
Microglia cell density (cell/mm2) was calculated from confocal images spanning the retinal and ONH depth from the NFL to the OPL in D2 and D2G mice aged 1 to 12 months. A) The numbers of microglia localized to the inner depths of the central retina and ONH show a significant increase in D2 samples from 1 month to 3 and 5 months of age (>1x in average). This trend continues at 8 months then decreases to about half the density by 12 months (P<0.05). However, D2G showed similar cell density to D2 at 1 and 3 months, which were maintained at 5 months, differing from D2's counts (1.5x higher in average). At 8 months, D2G increased their microglia density to levels comparable to D2, which showed a similar drop at 12 months. B) Microglia localized at the OPL in the central retina and ONH had the same density as those in the NFL to IPL in 1-month-old D2, and only decreased at 12 months (0P<0.05). In contrast, D2G OPL consistently maintained at all ages half the numbers of microglia found in D2 (P<0.001). C) At the mid-peripheral retina, microglia localized to inner layers changed with similar pattern to the inner central retina in D2 mice, except for statistical differences. Thus, they showed increases at 3 (1.2x in average) and 5 months, decreasing by 12 months. However, the cell counts in D2G samples maintained relative low densities, significantly below D2 values (1.7-2.3x higher in average). D) Deeper levels of the peripheral retina roughly followed the same changes described for the OPL at the central retina in both D2 and D2G mice, except for D2G having even lower densities of microglia at 3 months. A-D) Sample sizes per bar were, n=10. Comparisons represented as in Fig 7.