
Figure 1.
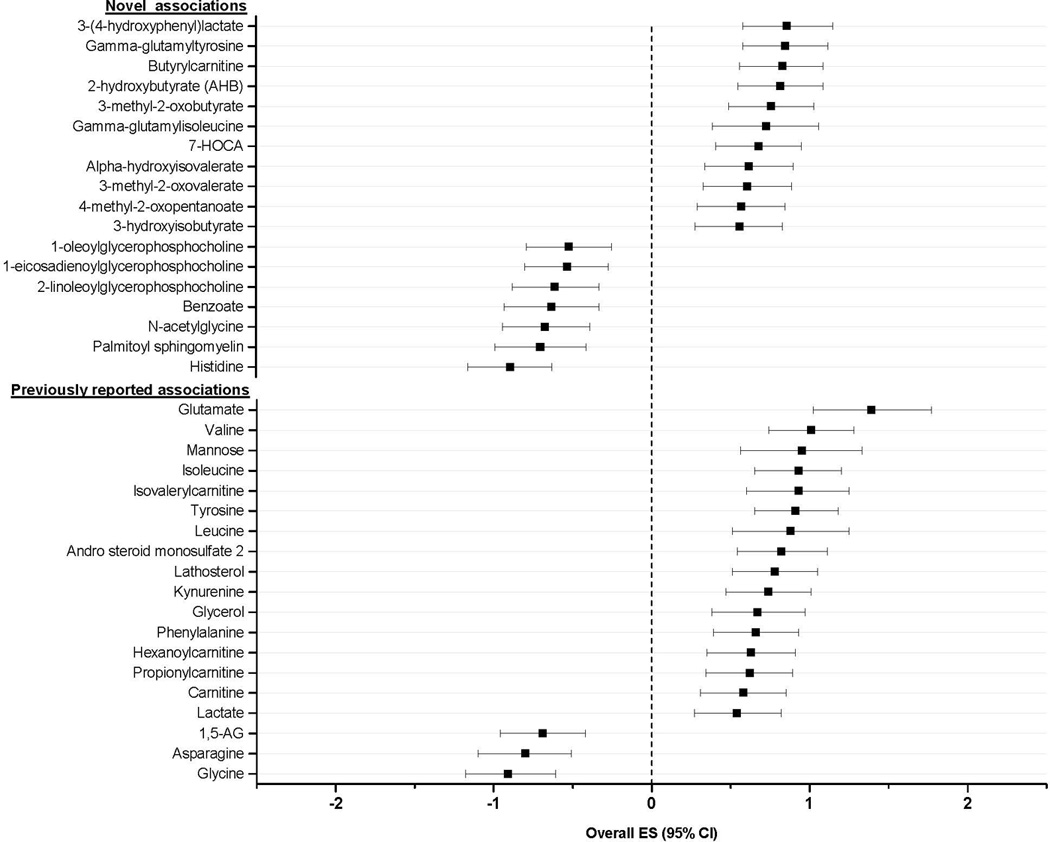
Effect sizes and 95 percent confidence intervals for combined associations between metabolite levels and body mass index. Results are based on a population of 947 participants (505 from PLCO, 258 from Navy, and 184 from Shanghai). Within each specific study, the association between metabolite levels and BMI was modeled using linear regression, adjusted for age, gender, current smoking status. PLCO models were additionally adjusted for study center and case status and Navy models were also adjusted for case status. The combined model was done using random effects meta-analysis. Only the metabolites that met the Bonferroni corrected threshold of statistical significance in the combined models, i.e. alpha=0.05/317=0.000158, are shown here. The overall effect size (ES)—the black square-- indicates the change in units BMI (kg/m2) per one standard deviation increase in metabolite level. The horizontal line indicates the 95 percent confidence interval of the estimate. The dotted line at zero overall ES is the line of no effect.