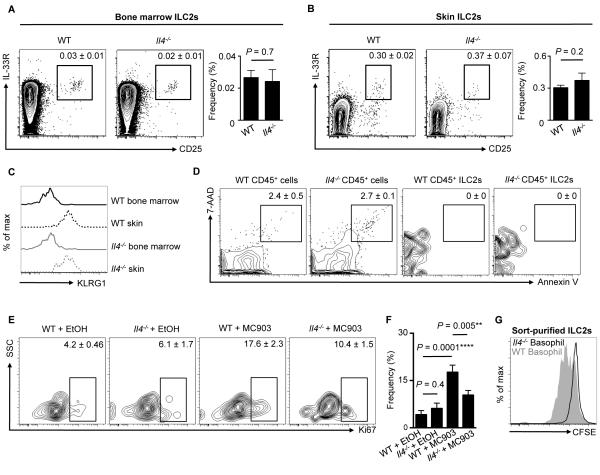
Figure 6.
Basophil-derived IL-4 promotes ILC2 proliferation. (A) Bone marrow (BM) and (B) skin ILC2 frequencies in WT and Il4−/− mice. Cell frequencies are noted as a percentage of Lin− cells. (C) KLRG1 expression on BM ILC2s from WT (solid black line) and Il4−/− (solid gray line) mice and skin ILC2s from WT (dashed black line) and Il4−/− (dashed gray line) mice. (D) Annexin V and 7-AAD expression on all CD45+ cells and CD45+ ILC2s from the skin of WT and Il4−/− mice. Cell frequencies are noted as a percentage of Lin− cells. (E) Ki67 expression on skin ILC2s from WT and Il4−/− mice treated with EtOH or MC903 and associated (F) frequencies. Cell frequencies are noted as a percentage of ILC2s. Data are representative of two independent experiments; n = 3-4 mice per group per experiment. (G) CFSE dilution of sort-purified CFSE-labeled ILC2s stimulated with WT (solid gray histogram) and Il4−/− (black line) TSLP-elicited basophil supernatants. Data are representative of two independent experiments; n = 3 mice per group per experiment. Actual P-values shown.

