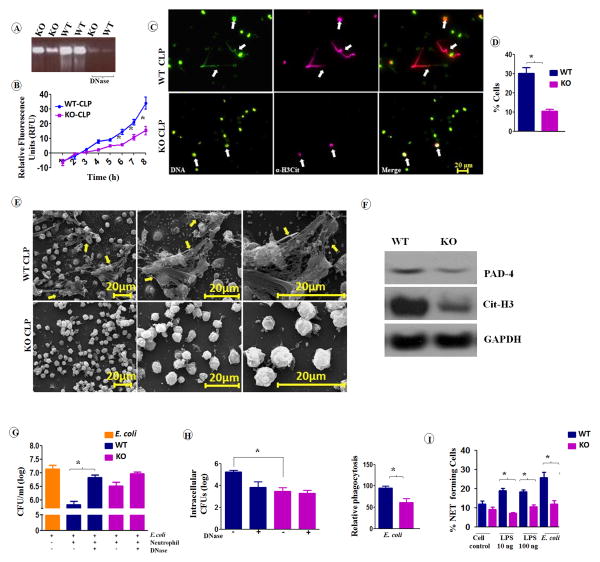
Figure 8. cxcl1−/− neutrophils exhibit decreased NET formation and NET-mediated bacterial killing in PMS.
A, Agarose gel electrophoresis of peritoneal fluid of cxcl1−/− mice exhibited reduced amounts of extracellular DNA compared to their WT counterpart after PMS. B, Kinetic analysis of NET formation by peritoneal neutrophils harvested from cxcl1−/− and WT mice. Relative fluorescent intensity was determined to evaluate NET formation each hour until 8 h of in vitro culture of neutrophils (n=6-9/group). C, Peritoneal neutrophils harvested from cxcl1−/− or WT mice after PMS, allowed to undergo NET formation and fixed at 8 h. Neutrophils were stained with Sytox green DNA stain and citrullinated histone H3 Ab to visualize citrullinated DNA after the cells were fixed with 4% (v/v) paraformaldehyde. Scale bars, 20 μm. Long strands of DNA (arrowhead) are evidence of NET formation. Images presented are representative images of three independent experiments (n=5-7/group). D, A total of 20 images were selected from one experiment and quantified for the presence of NET-positive neutrophils from cxcl1−/− and WT mice. The results are expressed as mean ± SE (n=5-8/group). E, Evaluation of NET formation by SEM. Peritoneal neutrophils harvested from cxcl1−/− and WT mice after induction of PMS were analyzed by SEM. Presence of long thread-like structures (arrowhead) is evidence of NET formation. Scale bars, 20 μm. Images presented are representative of two independent experiments (n=5-8/group). F, Western blot of PAD-4 and cittrullinated-H3 in the peritoneal neutrophils from cxcl1−/− and WT mice at 24 h post-PMS. This blot is representative of 3 independent experiments with similar results. G-H, Bone marrow neutrophils from cxcl1−/− mice exhibited diminished extracellular bacterial killing activity. Bacterial killing capacity of E. coli-infected bone marrow neutrophils from WT and CXCL1-deficient mice was determined by assessing extracellular (G) and intracellular CFUs (H) at 60 min after infection with E. coli (MOI 1). Relative phagocytosis of E. coli-infected WT and CXCL1-deficient neutrophils at 60 min post-treatment (MOI 1). A total of 4–5 mice/group were used. I, The percentage of NET-forming bone marrow neutrophils following LPS and E. coli stimulations were quantified after staining with Sytox green DNA stain and anti-α H3-Cit antibody as described above. The results are expressed as mean ± SE from two independent experiments (n=5-8/group: *, p<0.05; **, p<0.01; ***, p<0.001).

