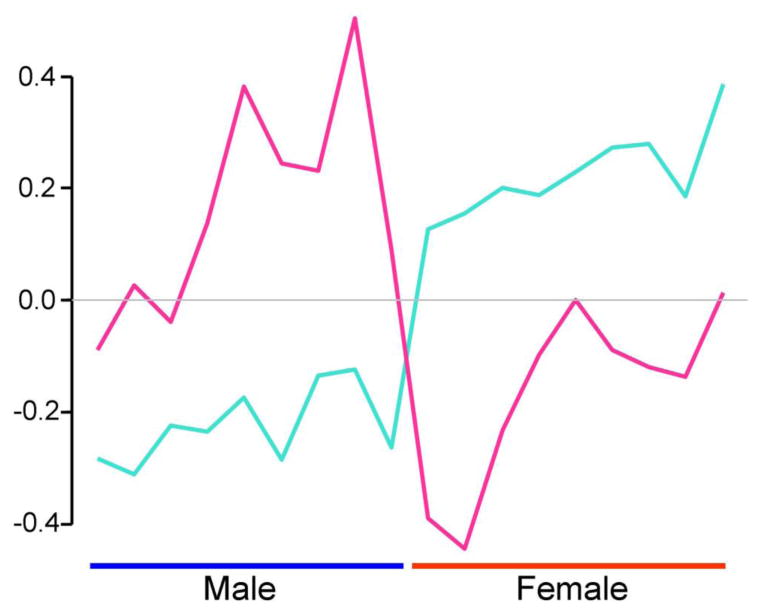
Figure 4.

The expression value of the module eigengene is graphed for turquoise and pink modules, across the 18 samples. The two modules were both sexually dimorphic, but show different patterns of sexual dimorphism, accounting for the separation of the genes into these two modules.
