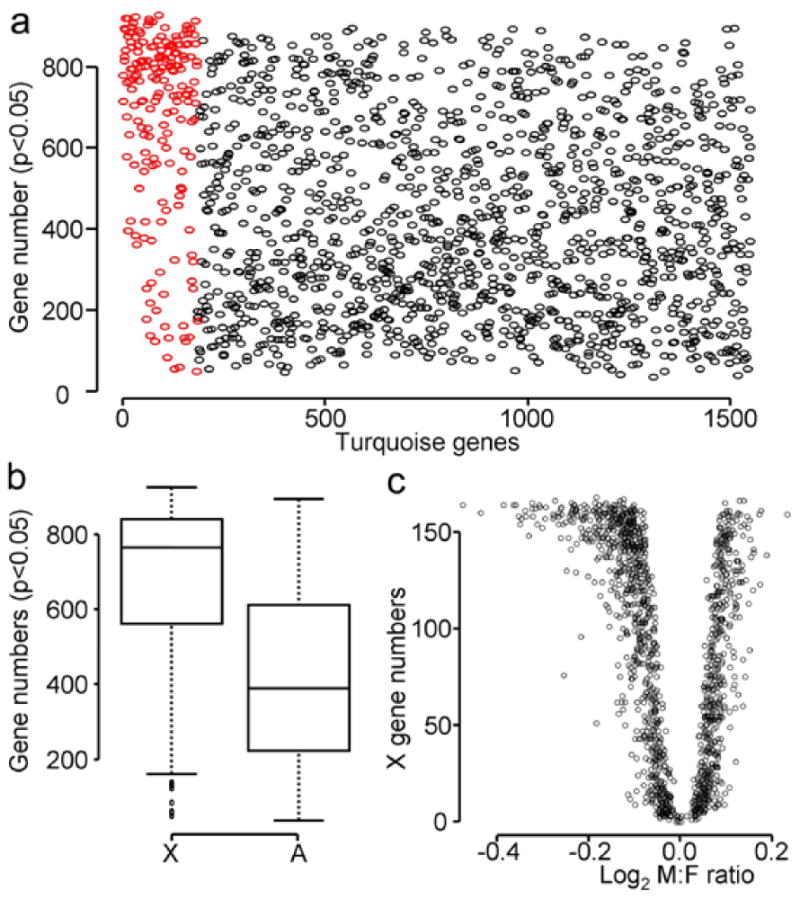
Figure 5.

X chromosome genes, more than autosomal genes, correlate with autosomal genes in turquoise module. a) The numbers of autosomal genes that correlated significantly (p<0.05) with X (red) and autosomal (black) genes are plotted. Each circle represents an individual gene. b) Box plot of the numbers of significantly correlated with autosomal genes in 5A. X genes correlated with more autosomal genes than autosomal genes did (t-test: p-value < 2.2e-16). c) The relationship between male to female ratio and the number of X genes that correlated with each autosomal genes in the turquoise module. The turquoise module autosomal genes with lower M:F ratios were correlated with a higher number of X genes, compared to autosomal genes with higher M:F ratios.
