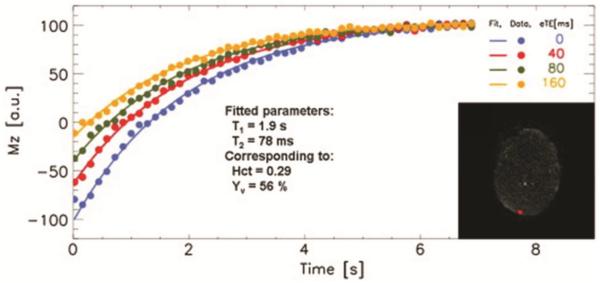
Figure 4.
T2-TRIR measurement of Yv at superior sagittal sinus[32]. Four inversion recovery curves of blood signal from sagittal sinus with different T2-weighting are shown. Insert: The brain tissue is saturated, while only inflowing blood within the sagittal sinus is visible.

