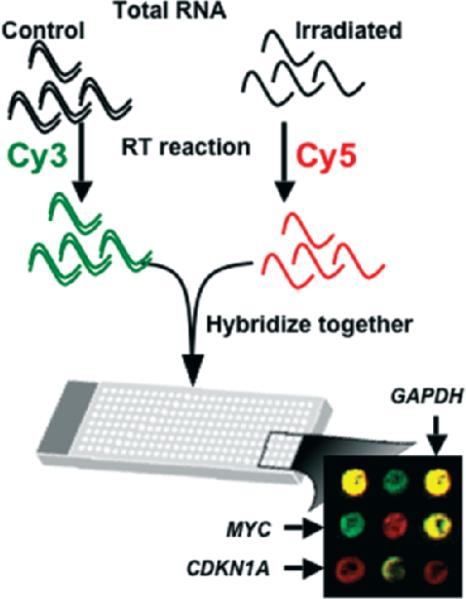
Figure 2.
Two-color microarray hybridization. Ribo-nucleic acid (RNA) from two different samples of interest is labeled by carrying out a reverse transcription reaction incorporating a different fluorochrome into each sample. In the example, the control sample is labeled with cyanine-5 (Cy5) and the irradiated sample with cyanine-3 (Cy3). The two samples are hybridized together to the same micro array. After washing and scanning, the brightness of each fluorescent wavelength in the scanned image is compared for each feature (a spot representing an individual gene). In the composite image, genes such as CDKN1A, which are upregulated by radiation exposure, appear as red spots, reflecting the fact that there are more copies of these genes present in the RNA pool that was labeled with the red flurochrome. Similarly, down-regulated genes, such as MYC, appear as green spots, and genes that do not change, such as GAPDH, have equal amounts of both colors and appear yellow.

