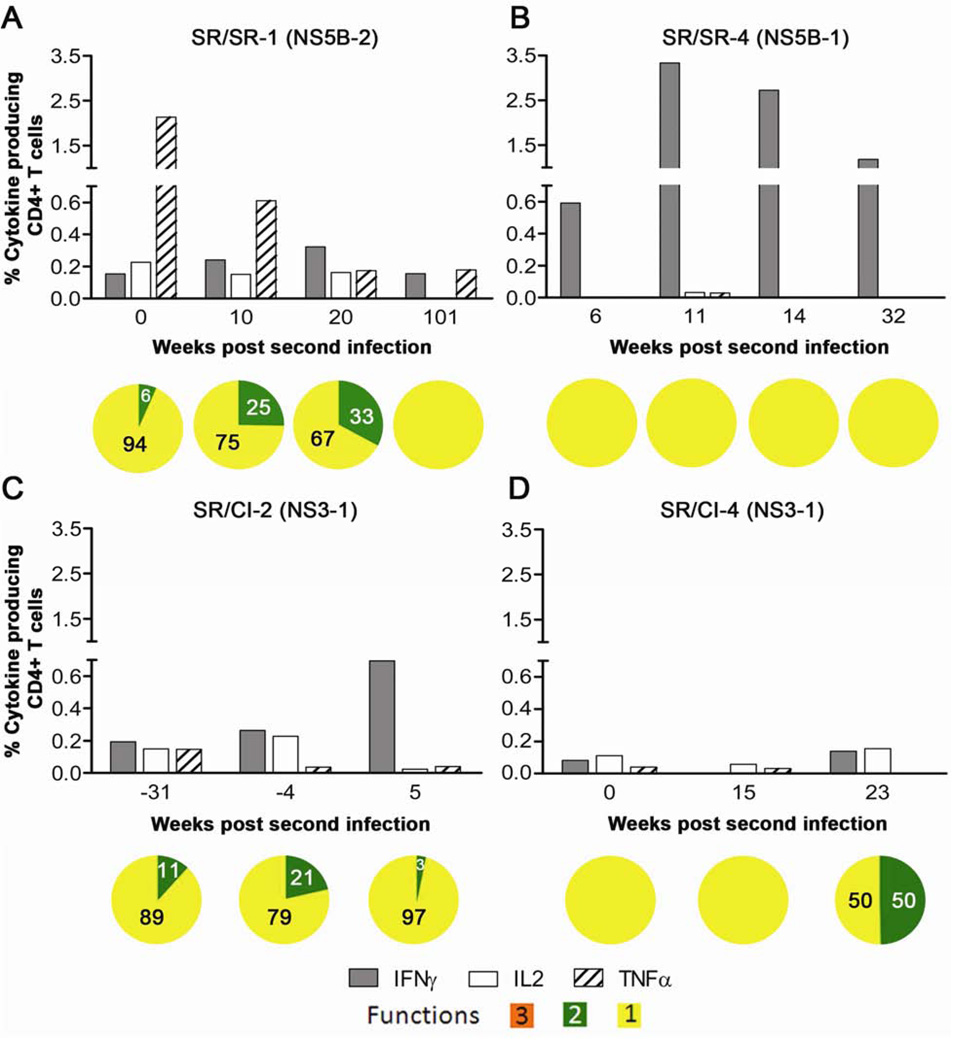
Figure 3. Higher production of cytokines by HCV-specific CD4 T cells from SR/SR patients as compared to SR/CI patients during reinfection.
PBMCs were stimulated with overlapping peptide pools representing HCV (NS3 and NS5B) and pools showing the highest response in the IFNγ ELISPOT then ICS was performed to measure the production of IFNγ, IL-2 and TNFα. Representative results from two SR/SR patients (A, B) and two SR/CI patients (C and D), gated on CD4+ CD3+ viable T lymphocytes. Peptide pools are indicated between brackets and represent the following regions: NS3-1 (NS3 aa: 1016–1341), NS5B-1 (NS5B; aa: 2416–2720) and NS5B-2 (NS5B; aa: 2710–3014). For polyfunctionality, orange represents triple functional cells, green represents double functional and yellow represents monofunctional cells of any combination.

