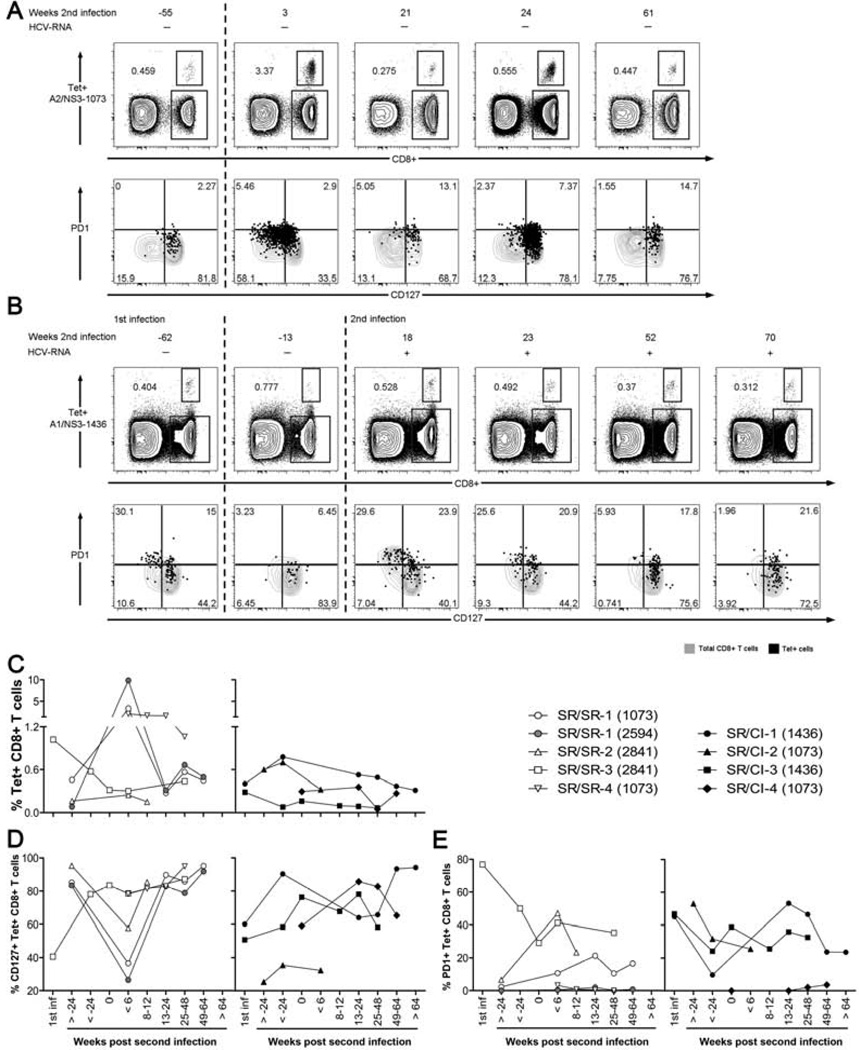
Figure 6. Expansion of HCV-specific tetramer+ CD8 T cells upon reinfection and generation of a CD127lo effector T cell population in SR/SR patients.
HCV tetramer staining and phenotyping were performed directly ex vivo on PBMCs from the indicated time points. Representative dot plots for longitudinal tetramer staining (upper panels) and phenotyping (lower panels) for (A) patient SR/SR-1 with A2/NS3-1073 tetramer and (B) patient SR/CI-1 with A1/NS3-1436 tetramer. Top panels are gated on viable CD3+ T lymphocytes. Lower panels are gated on viable CD3+CD8+ T lymphocytes. Tetramer frequency is represented as percent Tetramer+ CD8+ CD3+ T cells. In lower panels, black dots represent the tetramer+ HCV-specific CD8+ T cells overlaid on grey contour plots of CD8+ CD3+ T cells. Numbers in each quadrant represent percent expression on tetramer+ CD8+ CD3+ T cells. The dashed lines delineate the different infection episodes. (C–E) Tetramer expansion and phenotyping data from all SR/SR and SR/CI patients; (C) Frequency of HCV tetramer+ CD8+ CD3+ T cells, (D) Frequency of CD127+ tetramer+ CD8+CD3+ T cells, (E) Frequency of PD1+ tetramer+ CD8+CD3+ T cells.

