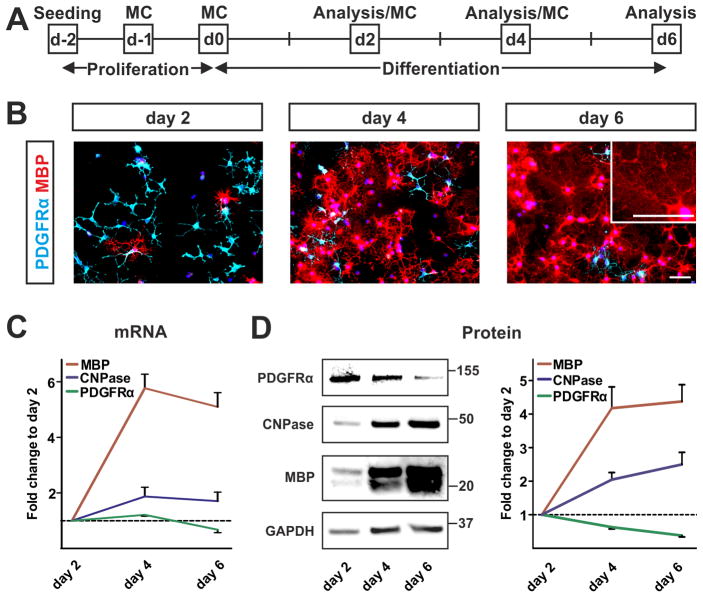
Fig. 1. Monitoring maturation of primary OPCs.
(A) Experimental paradigm to analyze differentiation of primary OPCs. Maturation of primary OPCs was assessed after 2, 4, and 6 days of differentiation. MC = medium change. (B) Immunocytochemical evaluation (n=3) reveals decreasing numbers of PDGFRα-positive oligodendrocyte precursors (light blue) paralleled by increasing numbers of MBP-positive mature oligodendrocytes (red) during differentiation. Note the advanced maturated morphology of oligodendrocytes with enlarged plasma membranes at day 6 of differentiation (insert). Scale bars: 50μm. (C) mRNA expression profile of oligodendrocytic markers (n=4) confirms progressive maturation of primary oligodendrocytes within 6 days of differentiation. (D) Western blot analysis (n=5) shows the temporal dynamic of oligodendrocyte maturation. Quantification of protein expression patterns reveals a decline in PDGFRα expression while myelin gene expression (CNPase, MBP) increases during differentiation. Analysis of GAPDH expression serves as loading control.

