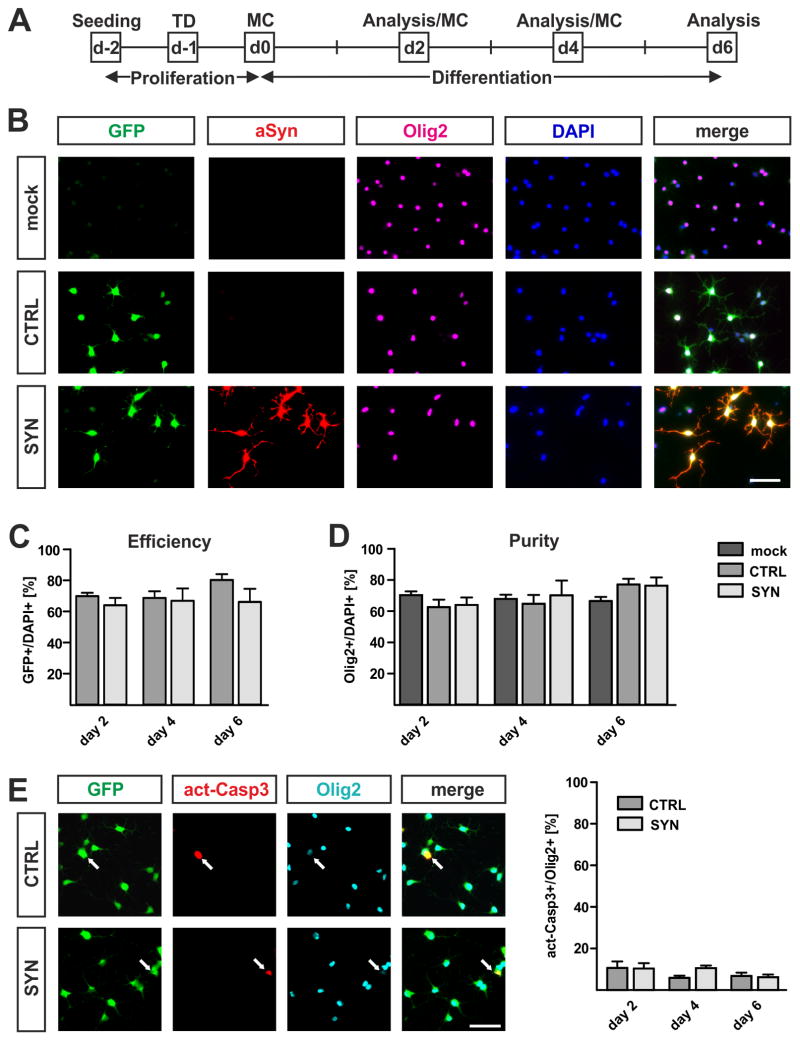
Fig. 2. Lentiviral transduction of primary OPCs.
(A) Experimental paradigm to assess the effect of lentivirally expressed h-aSyn on primary OPC maturation. One day after seeding, transduction (TD) was performed. After another day, differentiation was started. MC = medium change. (B) Representative pictures taken at day 2 of differentiation for the immunocytochemical evaluation of OPC purity and survival as well as lentiviral transduction efficiency. Notice the absence of h-aSyn immunoreactivity (red) in mock as well as CTRL transduced cultures and the completely overlapping expression of GFP (green) and h-aSyn in SYN transduced cells. Note that most DAPI-positive cells (blue) express the oligodendrocyte lineage marker Olig2 (magenta). Scale bar: 50μm. (C) Determination of lentiviral transduction efficiency as percentage of GFP-positive cells of total DAPI-positive cells (n=3). Both lentiviruses result in a high and comparable number of transduced cells (total means: CTRL 72.9%, SYN 65.6%). (D) Quantification of culture purity illustrated as the percentage of Olig2-positive cells of total DAPI-positive cells (n=3). The number of Olig2-positive cells changes neither during differentiation nor by comparing non-transduced and transduced cultures (total means: mock 68.2%, CTRL 68.1%, SYN 70.1%). (E) Immunocytochemistry (n=3) confirms the absence of an increased apoptotic profile in SYN compared to CTRL transduced oligodendrocytes. Arrows in representative pictures taken at day 2 of differentiation depict apoptotic Olig2-positive cells expressing activated Caspase 3 (act-Casp3). Quantification reveals ≤10% act-Casp3-positive oligodendrocytes during differentiation of both CTRL and SYN transduced oligodendrocytes. Scale bar = 50μm.

