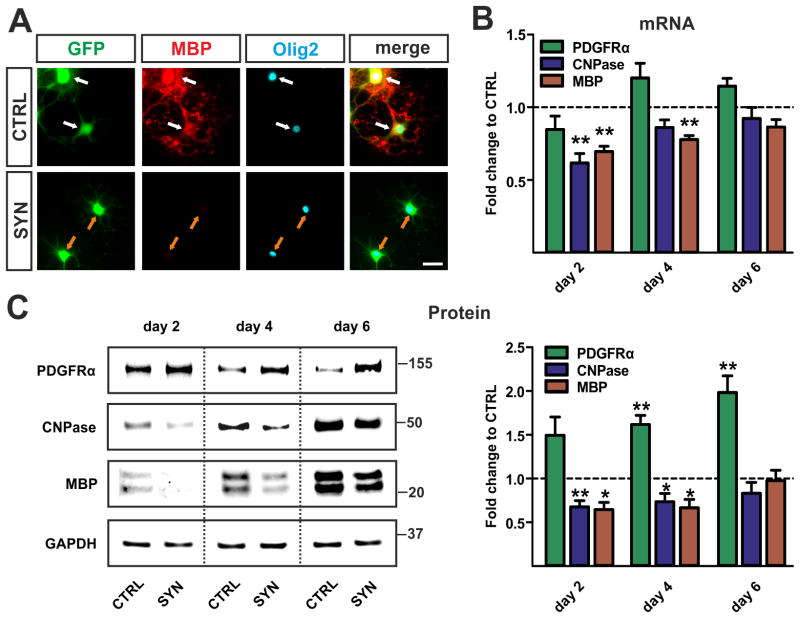
Fig. 4. Impaired maturation of h-aSyn expressing OPCs.
(A) Representative pictures of oligodendrocytes (identified by Olig2 expression) at day 4 of differentiation. Note that CTRL transduced oligodendrocytes already show MBP expression (white arrows) whereas the SYN transduced cells do not (orange arrows). Scale bar: 20 μm. (B) mRNA expression profile (n=4) of oligodendrocyte maturation markers for h-aSyn and GFP expressing cultures (SYN) relative to solely GFP expressing controls (CTRL). Significantly lower levels of myelin gene transcripts (CNPase, MBP) are detected in h-aSyn expressing cells at day 2 and day 4 of differentiation. The difference in myelin gene expression is not present at day 6. (C) Western blots (n=5) comparing expression of progenitor and maturation markers between SYN and CTRL oligodendrocytes. Densitometric analysis reveals significantly increased levels of the progenitor marker PDGFRα in h-aSyn expressing cells reaching the highest difference at day 6. Note the severely reduced levels of the myelin proteins CNPase and MBP in h-aSyn expressing oligodendrocytes at day 2 and day 4, however not present at day 6.

