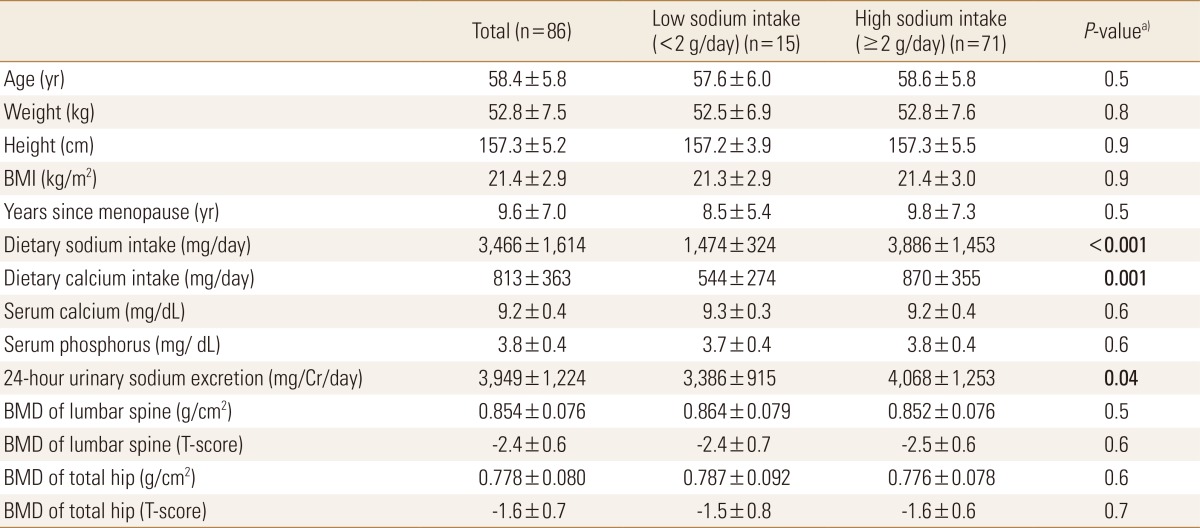
Table 1.
Baseline characteristics of the low (<2 g/day) and high (≥2 g/day) sodium intake group (n=86) based on modified food frequency questionnaire

Data presents as means±SD, statistical analysis by t-tests. Bold entries is a significant values of P<0.05.
a)P values for differences in baseline characteristics between sodium excretion groups.
BMI, body mass index; BMD, bone mineral density.
