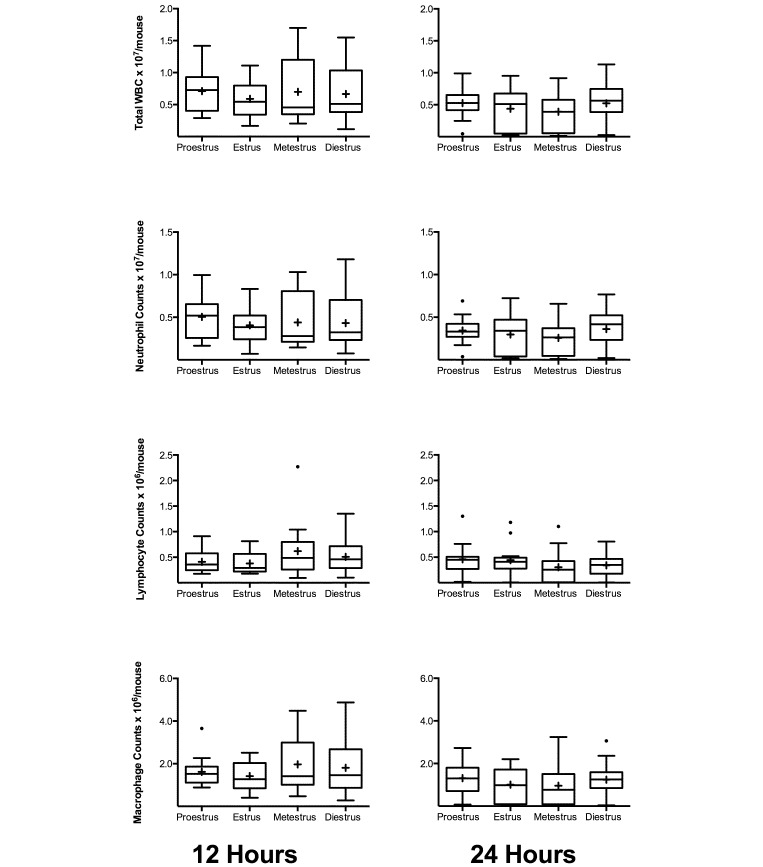
Figure 6.
Peritoneal cell counts for female BALB/c mice divided by estrous stage (12 h, n = 10 to 20 per group; 24 h, n = 13 to 20 per group). Mice underwent CLP, and whole blood was collected for cell counts at 12 and 24 h after CLP. Box indicates interquartile range; horizontal line and cross represent the median and mean, respectively. Whiskers represent the smaller of either 1.5 × interquartile range or range of the data. Dots represent outliers. No comparisons were significant at the less than 0.05 level.

