
Figure 7.
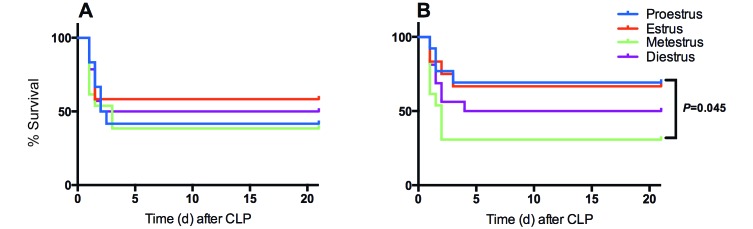
Kaplan–Meier survival curves after CLP for (A) saline- (n = 12 to 14 per group) and (B) buprenorphine- (n = 12 to 16 per group) treated female BALB/c mice divided by estrous stage. No significant difference in survival was seen in control mice based on estrous stage, but survival was significantly increased in buprenorphine-treated mice in proestrus as compared with buprenorphine-treated mice in metestrus. P values less than 0.05 are shown.